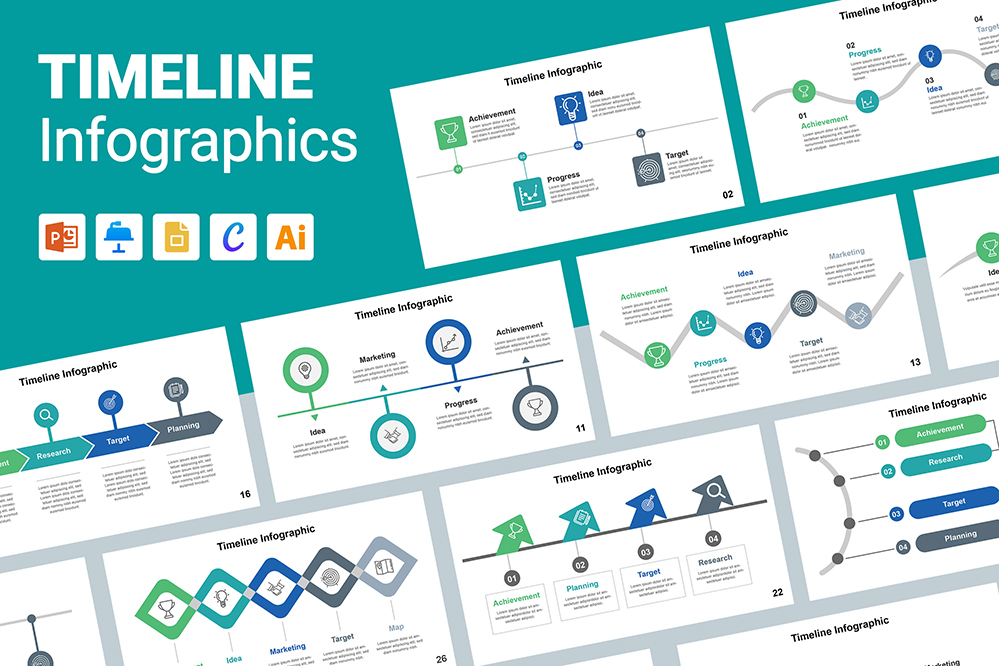
Timeline Infographics Template
Comprehensive Guide to Timeline Infographics Templates: Versatile Designs for Every Platform
A timeline infographic is a visual representation of events, milestones, or activities organized chronologically. It provides a clear and concise way to convey information, making it easier for the audience to understand the sequence of events over a specific period.
Timeline infographics are essential for simplifying complex information. They are widely used in various fields, including history, business, education, and project management, to illustrate developments over time. They enhance audience engagement, improve information retention, and transform data into a compelling narrative.
What Is a Timeline Infographic?
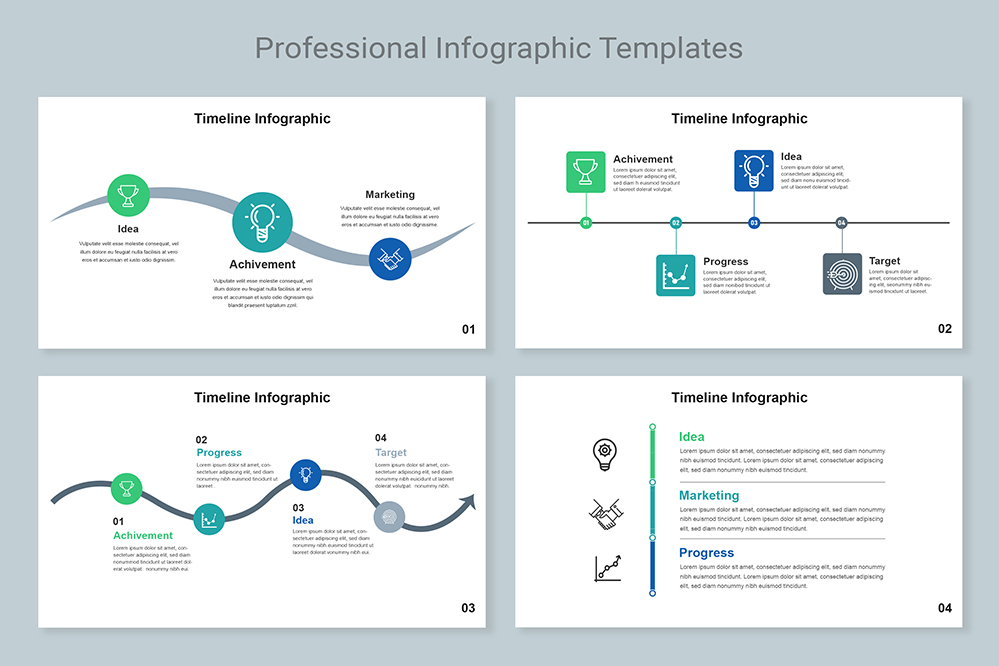
A timeline infographic visually represents chronological events, activities, or milestones displayed in a linear format. It is designed to present information in a clear, concise, and engaging manner, allowing viewers to quickly grasp the sequence and significance of events over a specific period of time. Timeline infographics are widely used in various fields, such as history, business, education, and project management, to illustrate historical events, project timelines, personal achievements, and more.
Key features of a timeline infographic typically include time markers (such as years, months, or days), events or milestones placed along the timeline, descriptions or captions explaining each event, and visual elements like icons, images, and colors to enhance understanding and visual appeal. By organizing information chronologically and incorporating visual elements, timeline infographics transform complex data into a compelling narrative, making it easier for audiences to comprehend and remember the information presented.
Different Types of Timeline Infographic
Timeline infographics come in various types, each serving unique purposes.
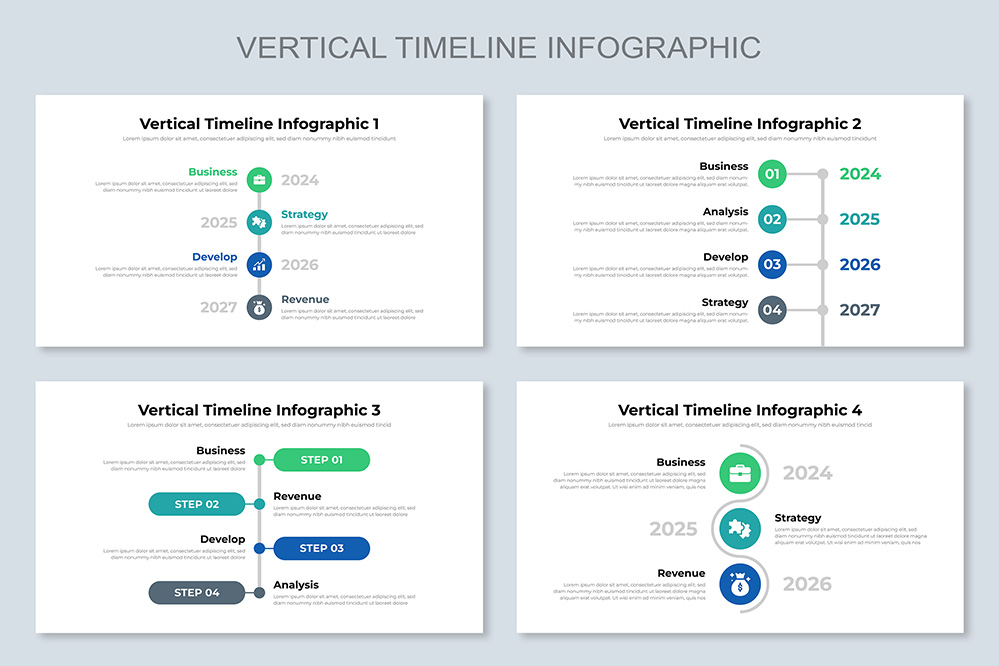
Vertical Timeline Infographic:
Vertical timelines flow from top to bottom, ideal for showcasing events in a step-by-step manner. Their linear design suits historical events, project progress, or personal journeys.
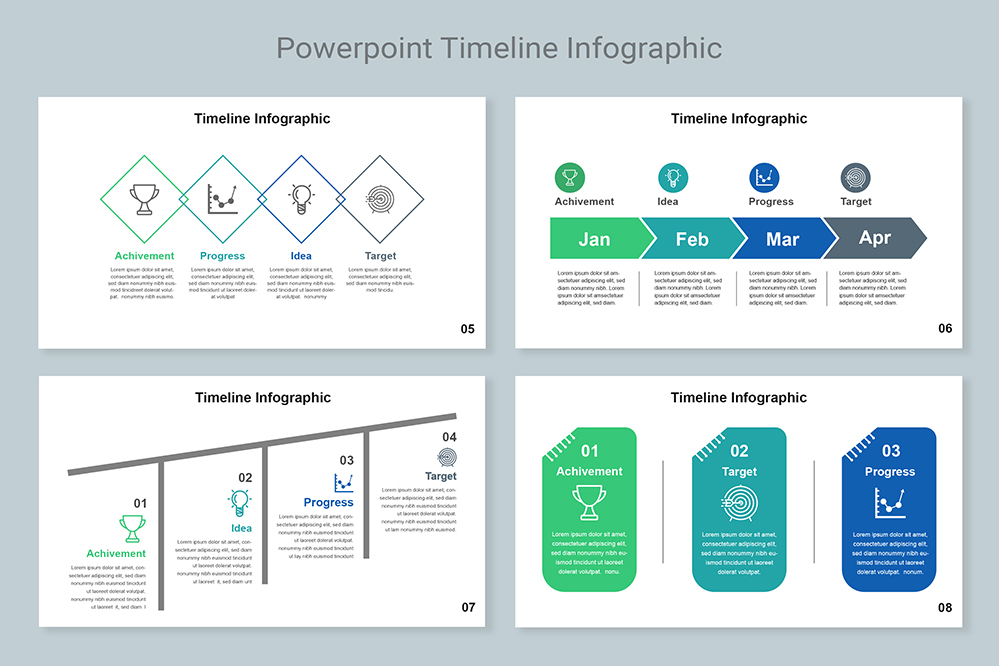
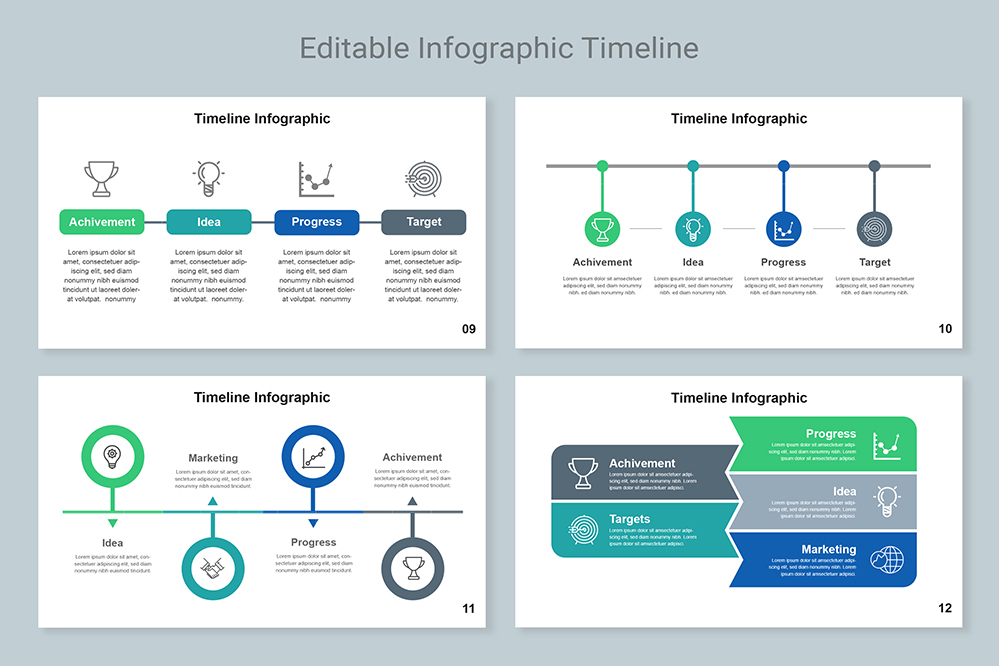
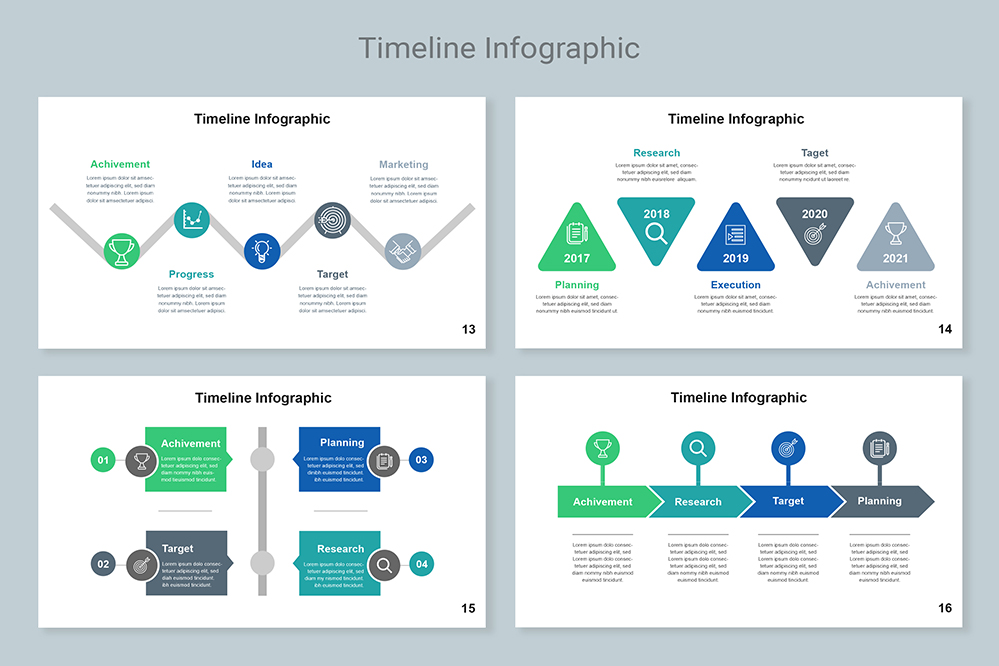
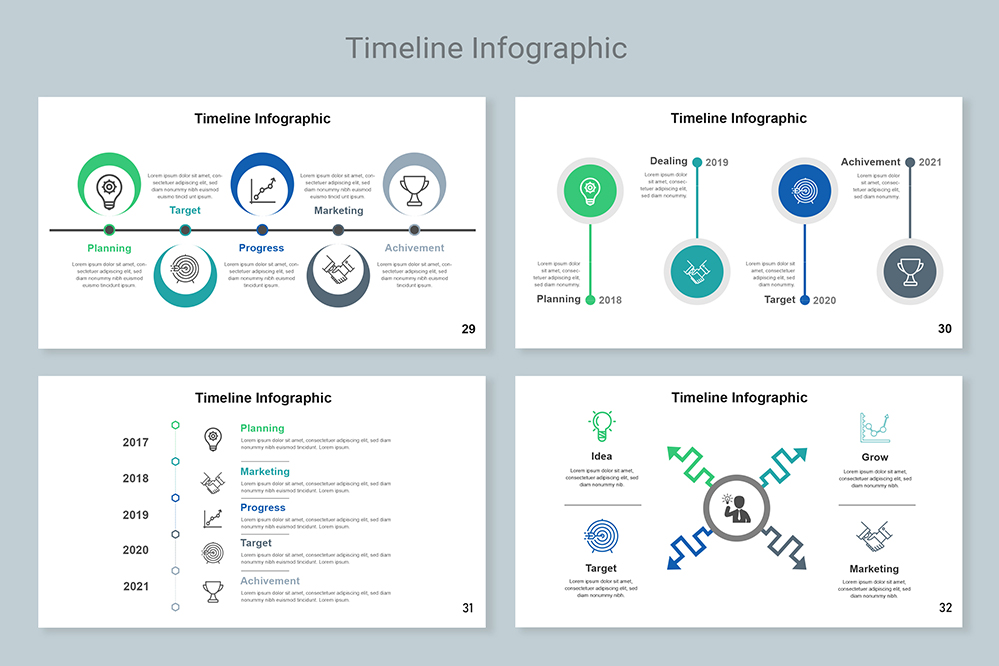
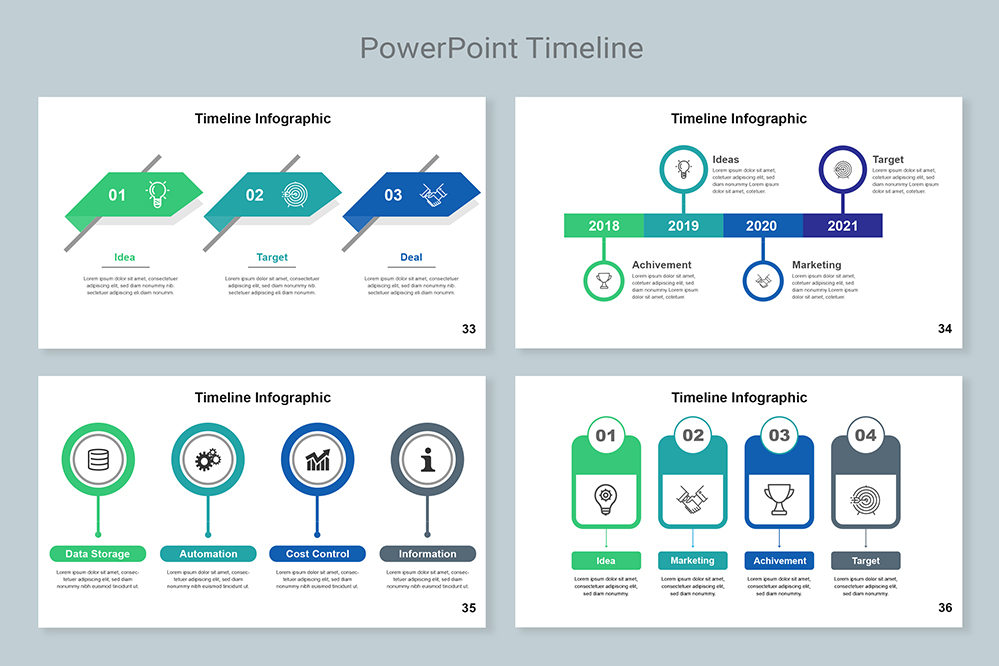
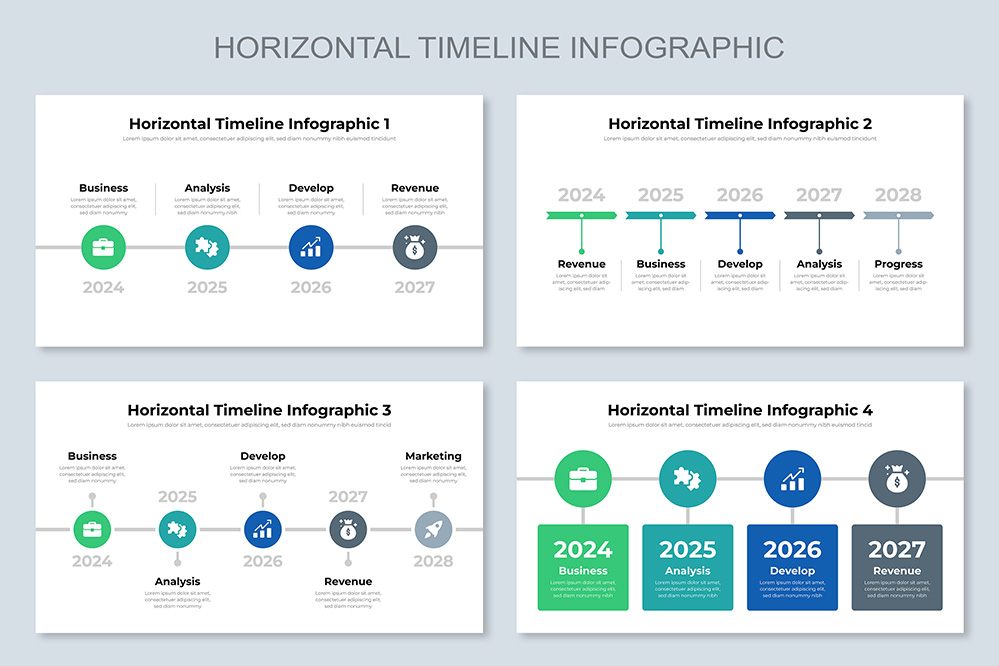
Horizontal Timeline Infographic:
Horizontal timelines extend from left to right, presenting events chronologically. They are excellent for illustrating historical sequences, project timelines, or company milestones with a clear flow.
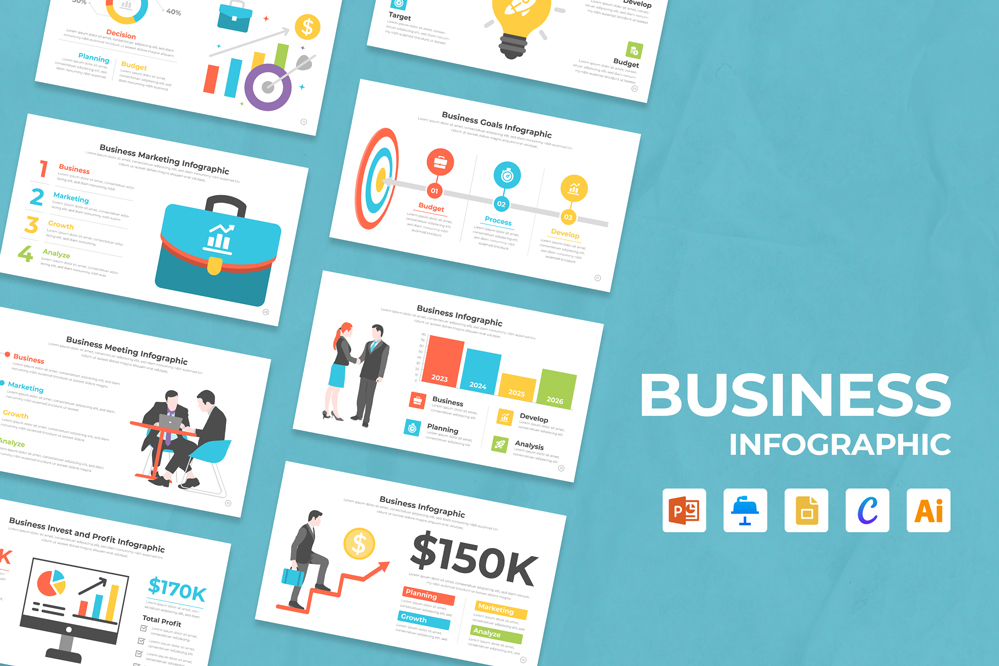
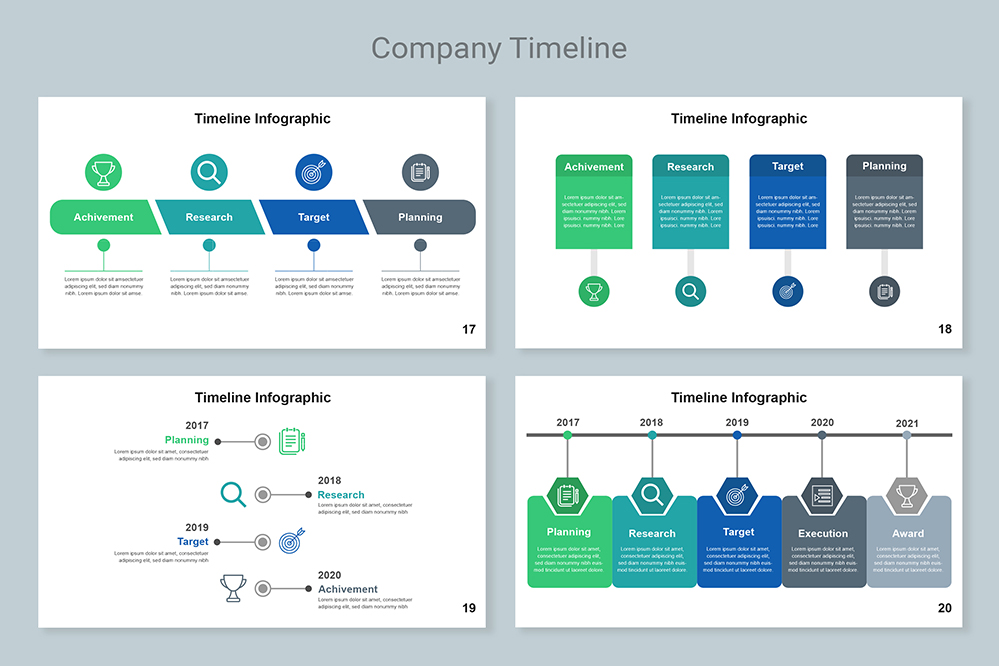
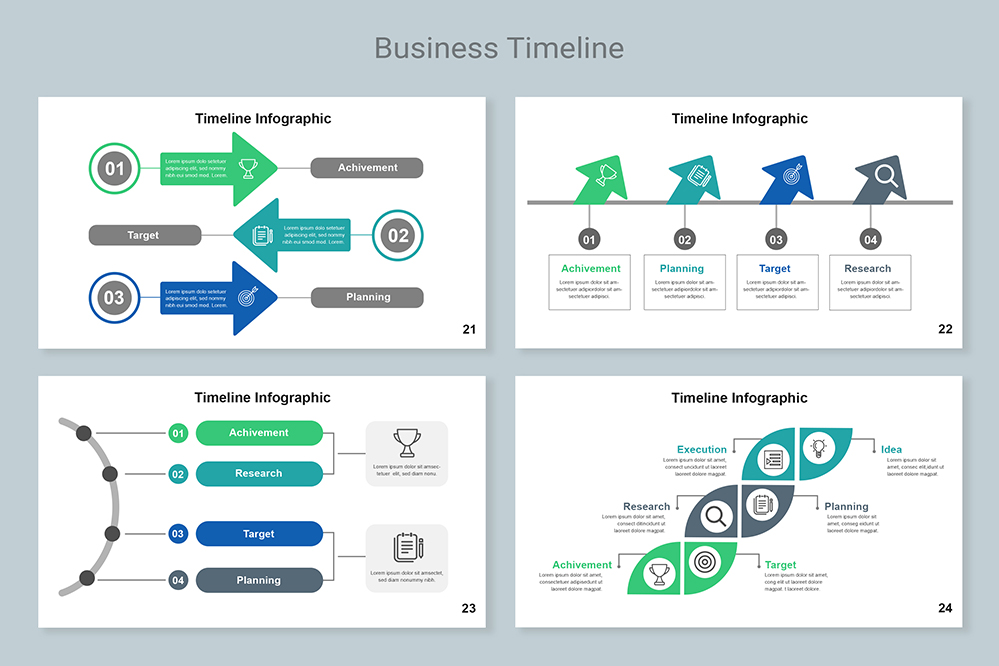
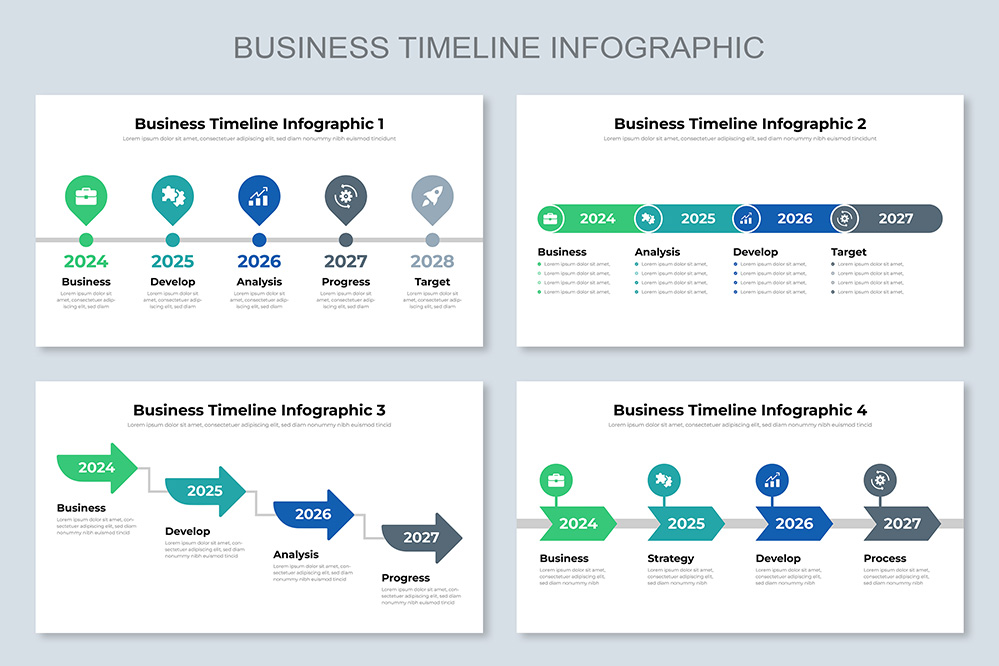
Business Timeline Infographic:
Business timelines emphasize company growth, product launches, and achievements. They highlight key milestones, mergers, and market expansions, providing stakeholders with a visual overview of the business journey.
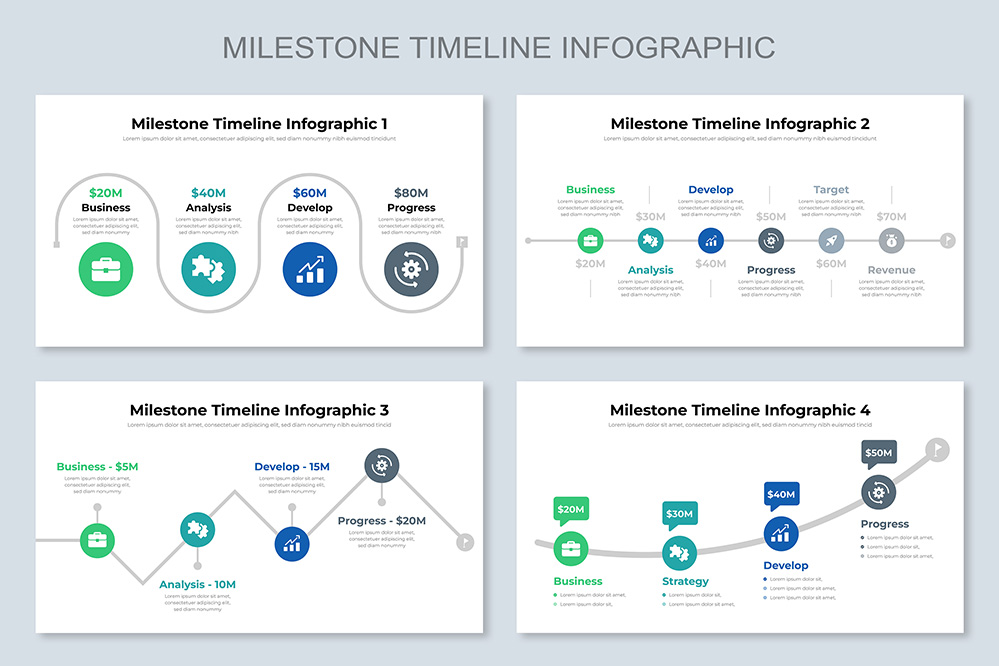
Milestone Infographic Timeline:
Milestone timelines focus on significant achievements. They pinpoint crucial events, project completions, or personal milestones. These infographics celebrate accomplishments, providing a visual representation of progress.
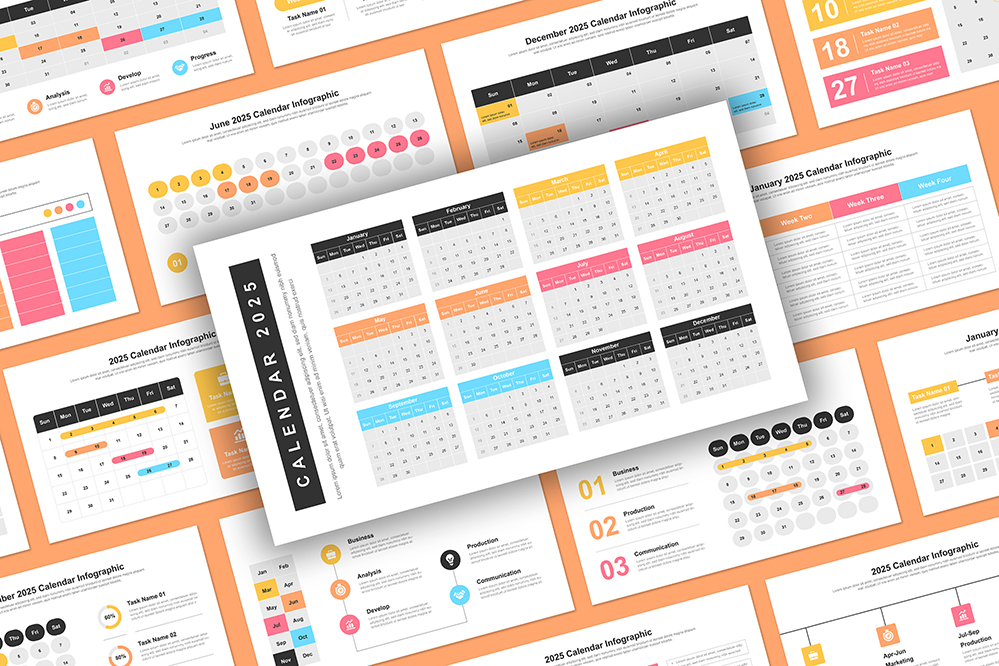
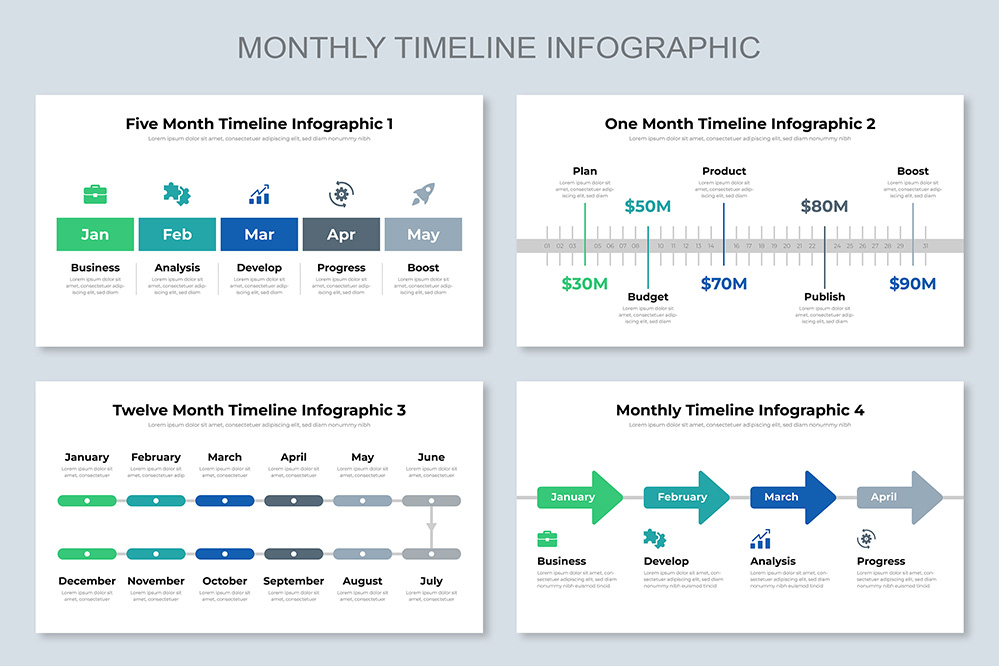
Monthly Timeline Infographic:
Monthly timelines break down events by months, offering a detailed view of developments over the course of a year. Perfect for project planning, marketing strategies, or event schedules, they emphasize monthly progress.
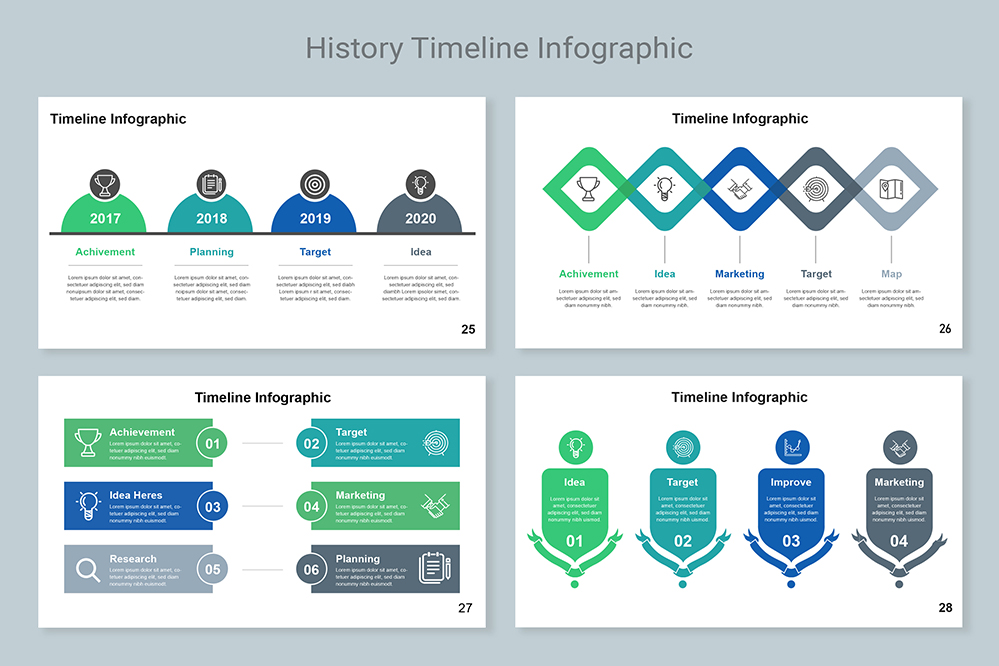
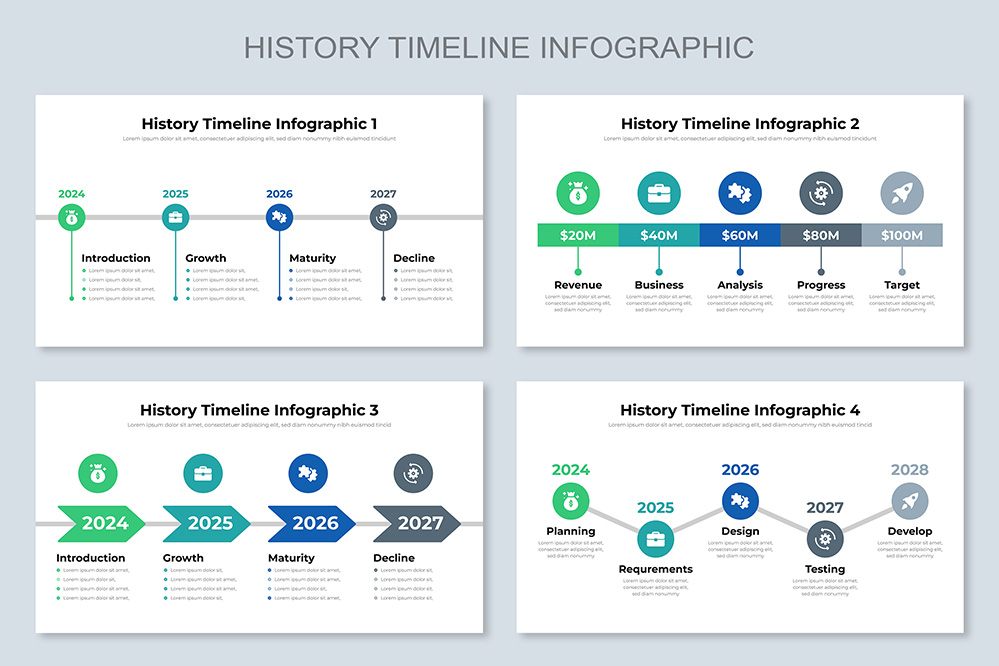
History Timeline Infographic:
History timelines chronicle historical events, showcasing the evolution of civilizations, cultures, and major world events. They serve as educational tools, offering a visually engaging journey through different eras and epochs.
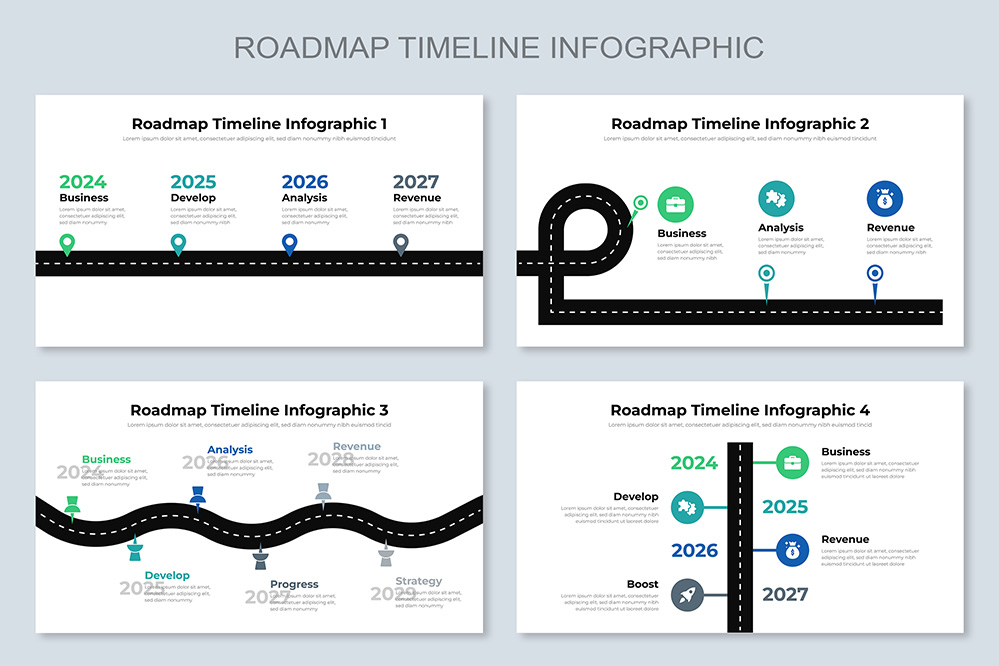
Roadmap Timeline Infographic:
Roadmap timelines outline future plans, product launches, or project strategies. They visualize the path ahead, highlighting key milestones, deadlines, and goals. Roadmap infographics aid in strategic planning and goal setting.
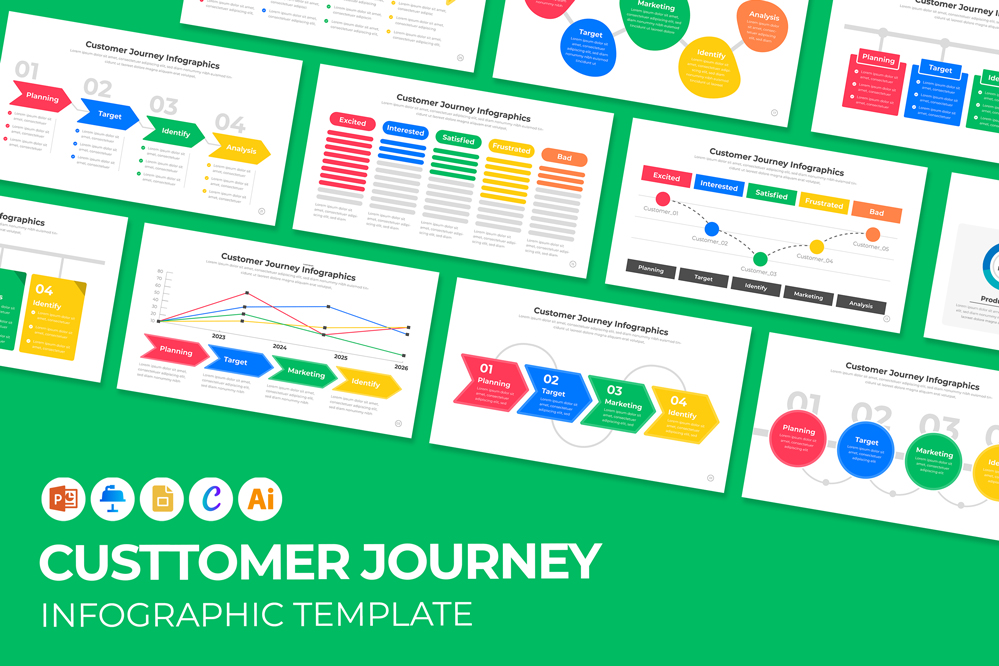
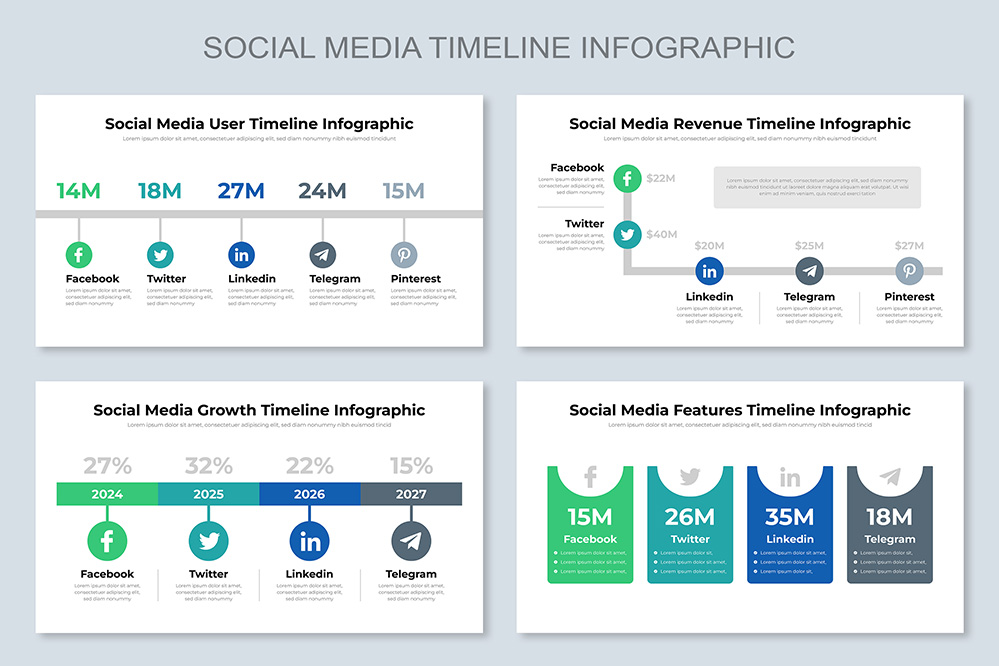
Social Media Timeline Infographic:
Social media timelines display the evolution of social media platforms, trends, and user statistics. They track the rise of networks, popular hashtags, and influential events, offering insights into the digital landscape’s transformation.
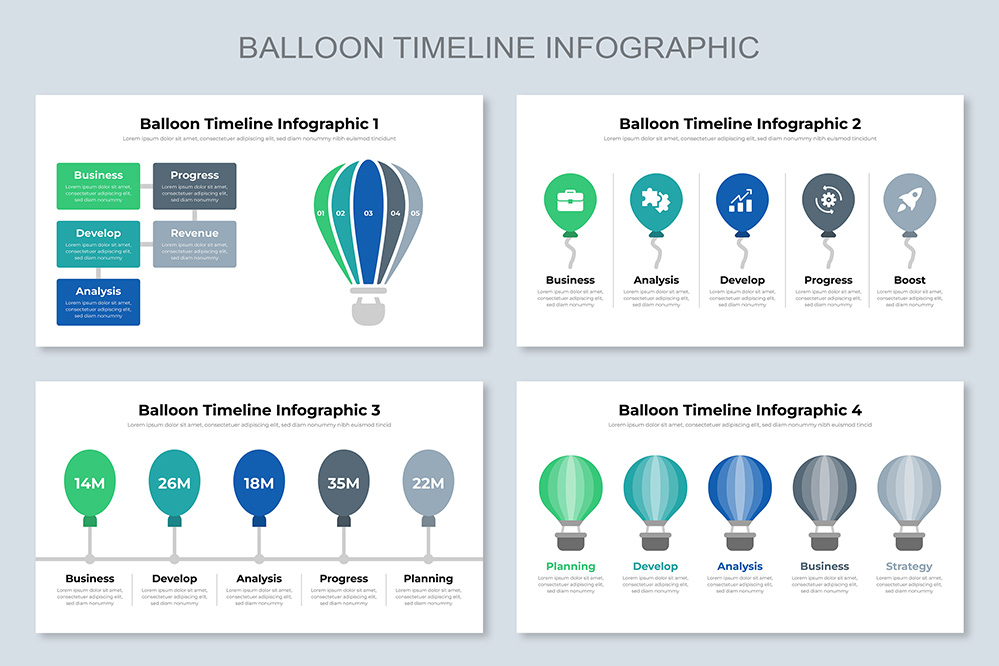
Balloon Timeline Infographic:
Balloon timelines use balloon-shaped elements to represent events, adding a playful and creative touch. Ideal for educational purposes or children’s projects, these infographics engage young audiences in a visually appealing manner.
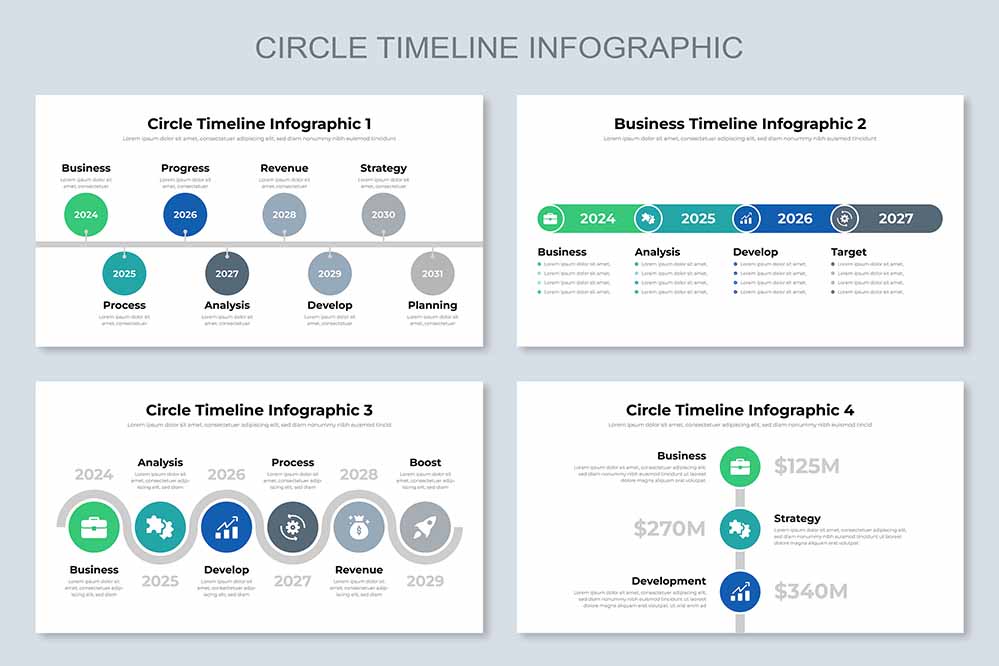
Circle Timeline Infographic:
Circle timelines use circular design elements to showcase events in a continuous loop. They are perfect for illustrating recurring processes, historical cycles, or ongoing trends. Circle timelines offer a unique visual perspective on events.
Timeline infographics serve as powerful tools for conveying information in a visually engaging manner. They simplify complex data, enhance understanding, and captivate audiences.
Share Now!
Purchase
$0.00
Compatibility
Unlock this Template
Timeline Infographics Template
mighty-infographics
Related Products