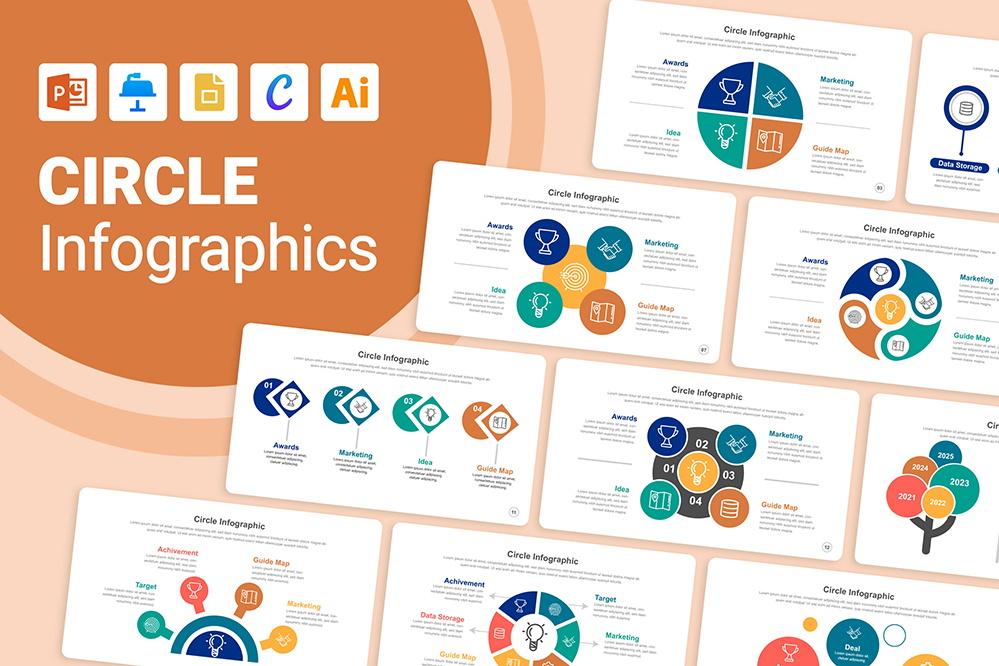
Circle Infographic Templates
Make your presentations pop with our eye-catching Circle Infographic Templates. These professionally designed templates allow you to showcase your key data and statistics in an engaging circular format that grabs attention. These circle infographics are fully editable and compatible with top applications like PowerPoint, Google Slide, Apple Keynote, Canva, and Illustrator. It’s easy to customize the designs and text elements to highlight your most valuable insights.
Upgrade your next presentation and let these infographic templates do the hard design work for you. Download These Circle Infographics now to create an impressive and intuitive presentation that resonates with your audience.
What are Circle Infographics?
Circle infographics, or radial infographics, are creative ways to visualize data and statistics in an eye-catching circular layout. These eye-catching circular layouts showcase statistics, facts, and figures in an intuitive and engaging format. But circle infographics aren’t just decorative – they also improve comprehension and memorability compared to standard data visualizations.
In a circle infographic, information is arranged radially, with your key data point or most important statistic in the center. Additional information radiates outward from the central focal point in segments around the circle. This format/style allows you to display multiple metrics in context with each other so viewers can easily see the relationships between data.
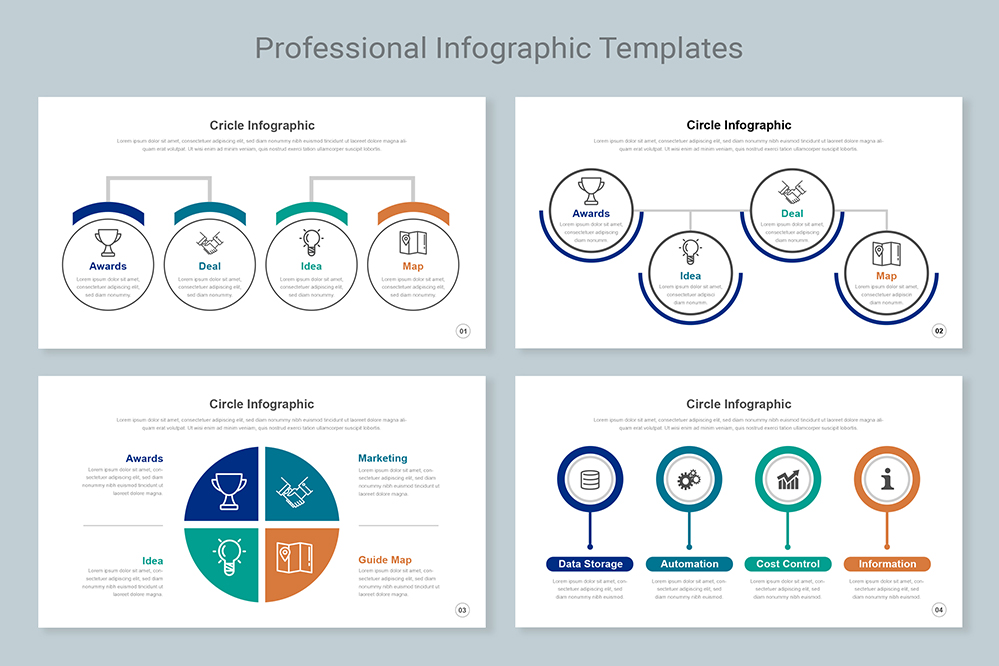
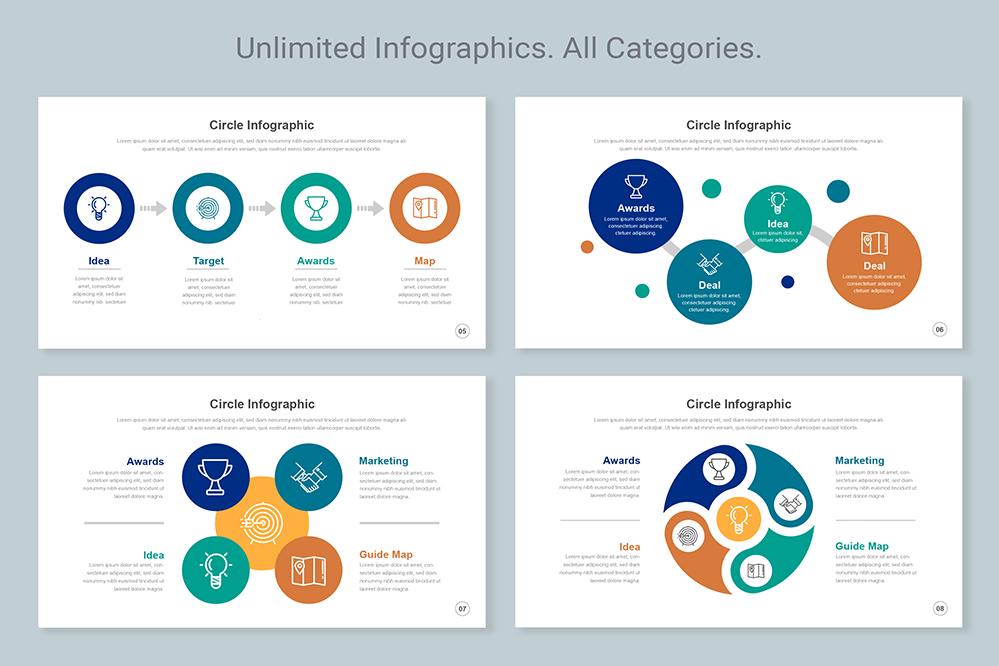
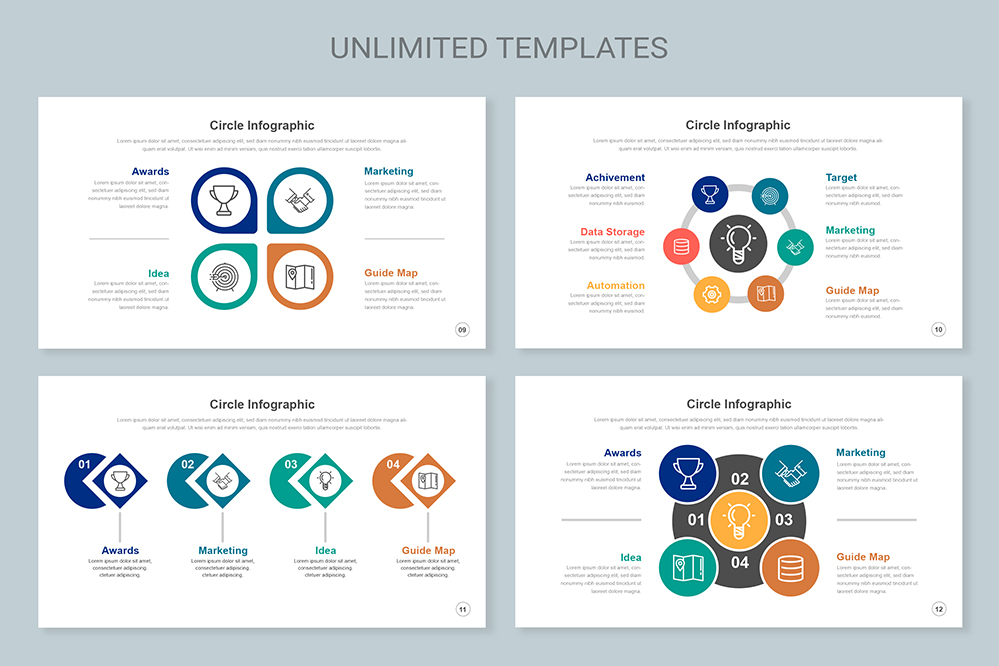
Different Style Circle Infographics Examples
We have different Circle infographics that come in many styles and formats to suit your needs and niche. You can personalize visual aspects such as color, fonts, icons, and others to align with your brand image or presentation concept. Choose from single, double, or multiple circle layouts depending on the amount of data you want to highlight. These infographics are available in widescreen 16:9 ratio and can be customized on Microsoft PowerPoint, Google Slide, Apple Keynote, Canva, and Adobe Illustrator.
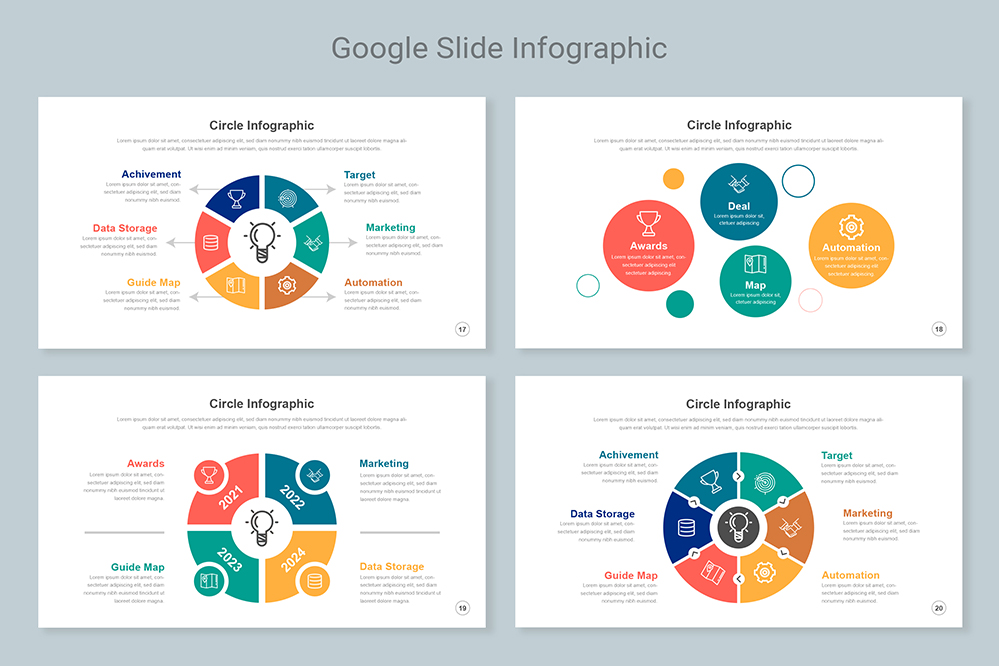
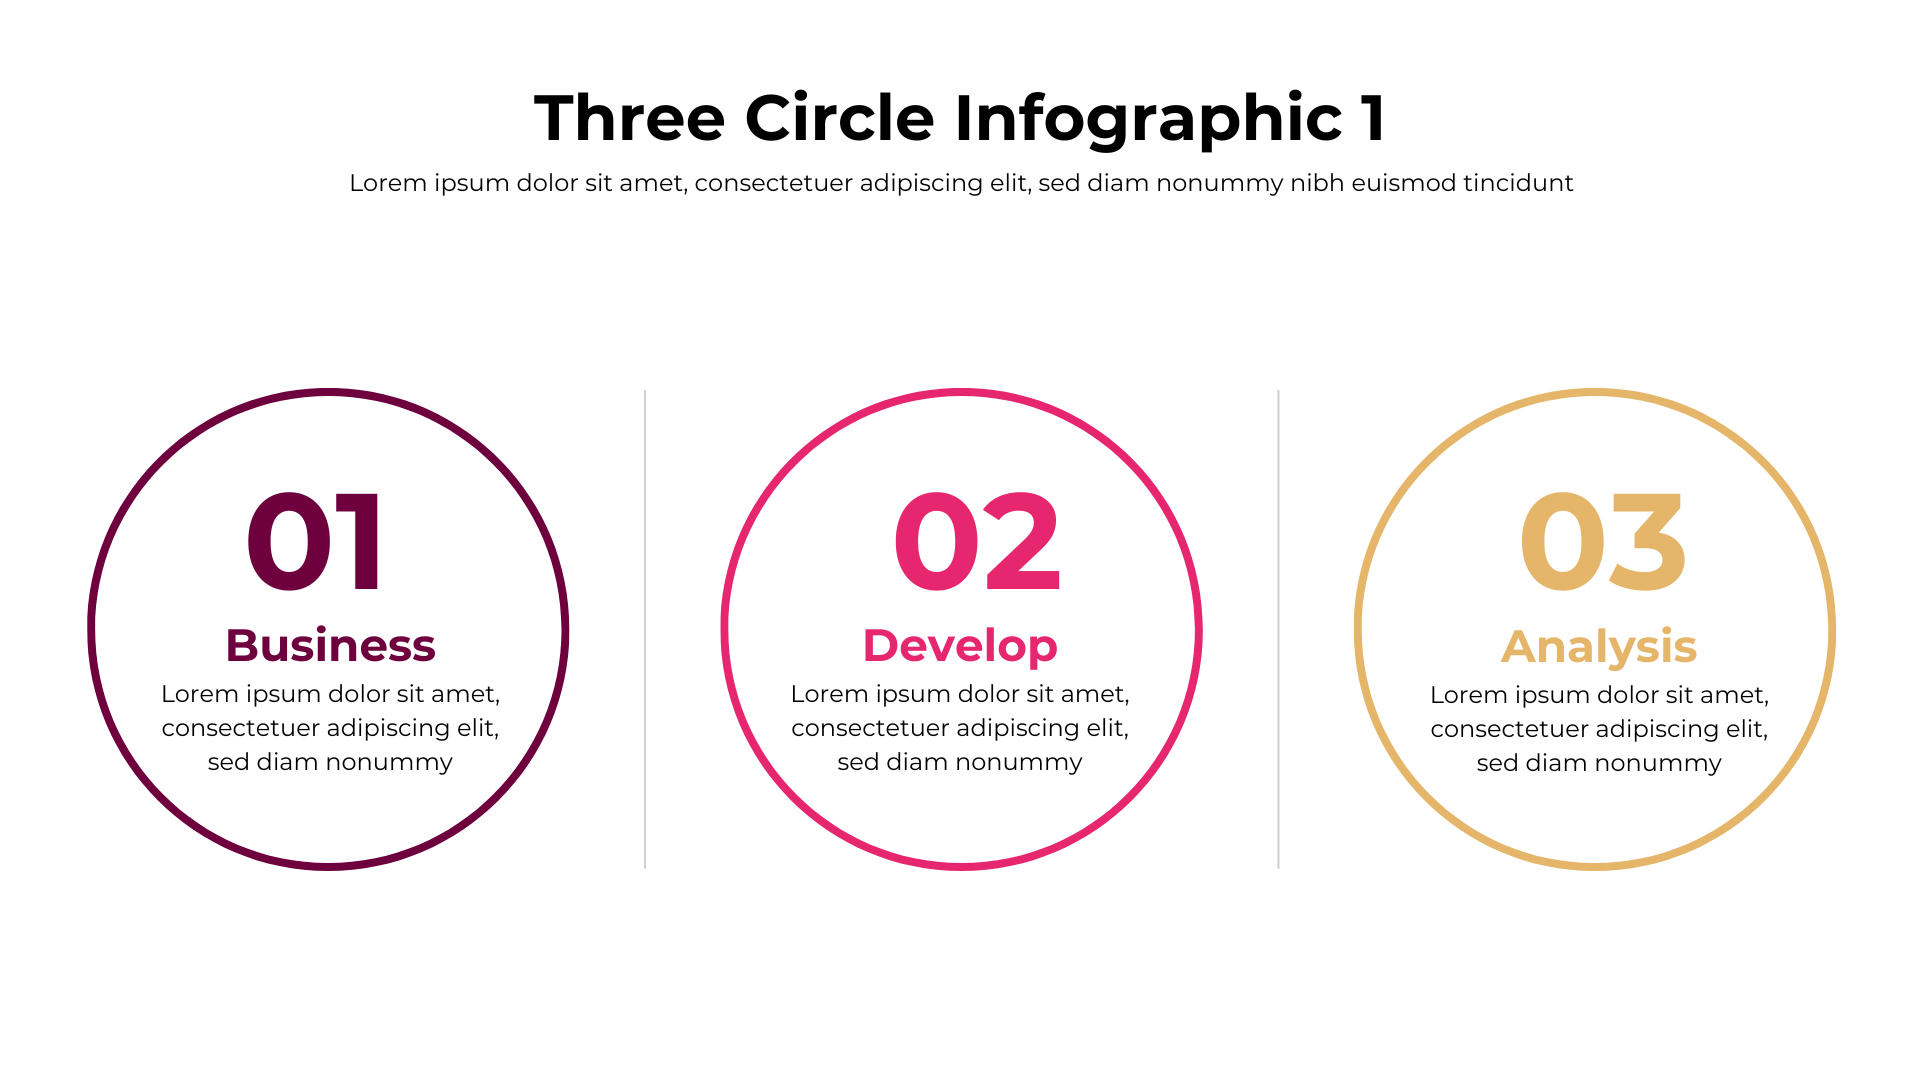
3 Circle Infographic Template
Three Circle Infographic is ideal for presenting a trio of important, interconnected statistics or stories. This format equally focuses the viewer on your three main data points in a simple yet bold style. 3 circle infographics highlight steps in a process same as process infographics, showcase product features or plan options, compare triples of numbers, and more. This Professional 3 Circle Infographic Templates will make your presentations and graphics stand out with its modern, circular aesthetic.
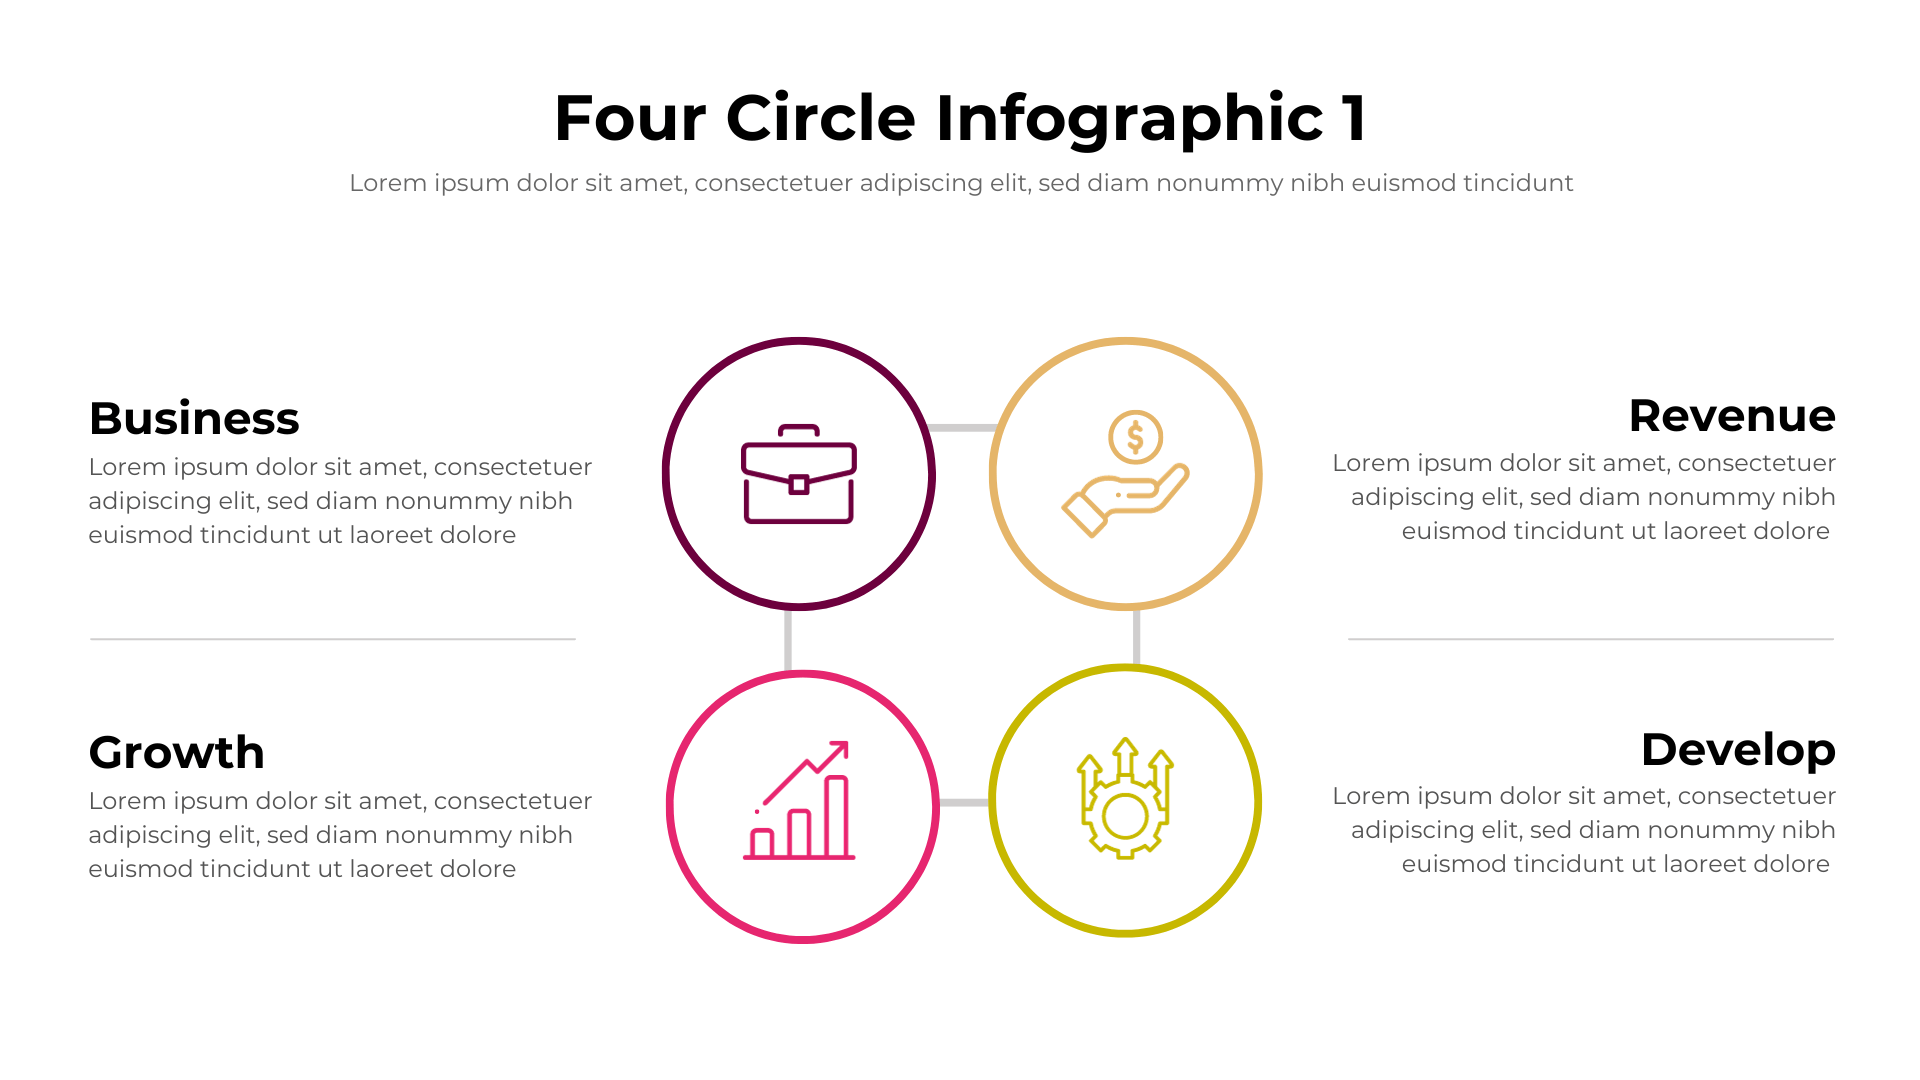
4 Circle Infographic Template
Explain any 4-stage process with clarity using this Professional 4 Circle Infographic Template. The interconnected circular layout spotlights each phase in an eye-catching graphic. Perfect for presenting workflows, cycles, timelines, and more. Perfect for comparing quarters or metrics, detailing a 4-step process, workflows, and business goals, or spotlighting your top four product lines or company values. The symmetry and balance of the four segments keep the visual uncluttered while allowing you to connect and contextualize four important details. This 4 circle process infographics keeps things clean, focused, and impactful when you have four clear takes on a topic.
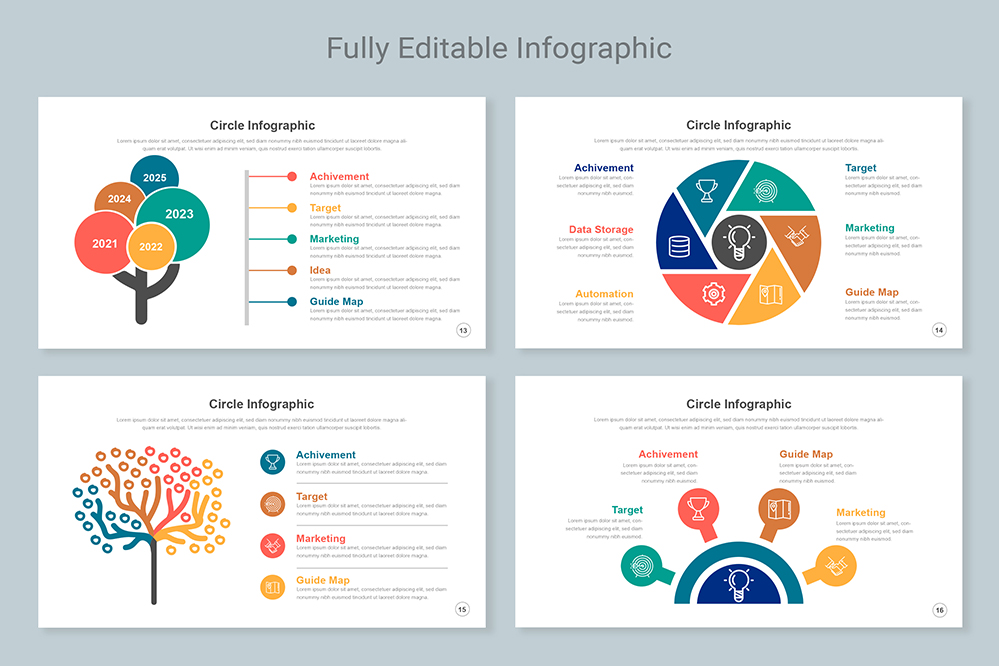
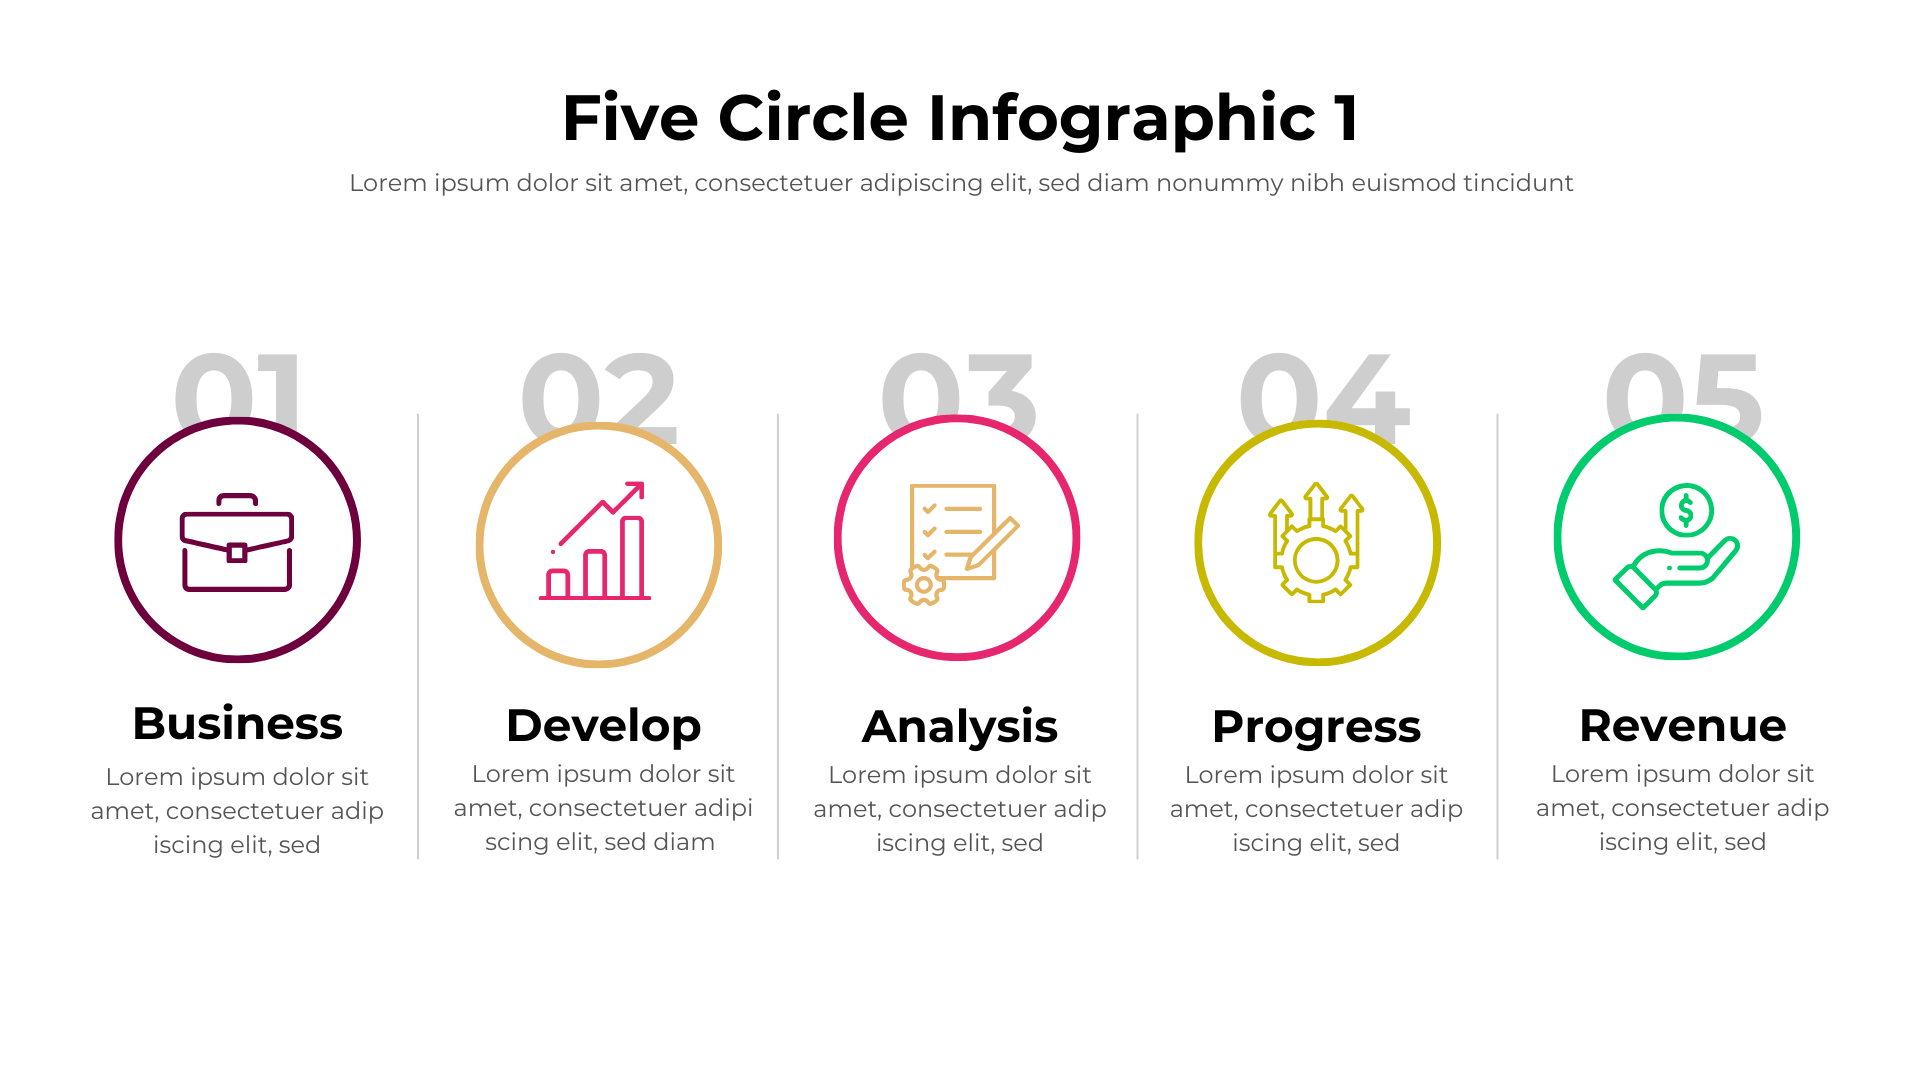
5 Circle Infographic Template
For presenting five major data stories, statistics, or supporting points, this circle infographics with 5 parts hits the sweet spot. The five distinct segments enable you to highlight relationships and connections between each data slice in a balanced circular layout. Ideal uses include showcasing five product lines, steps in a 5-stage process, ranking five metrics, business targets or goals, or any presentation usages. All you need to do is download this infographic and edit with any presentation software.
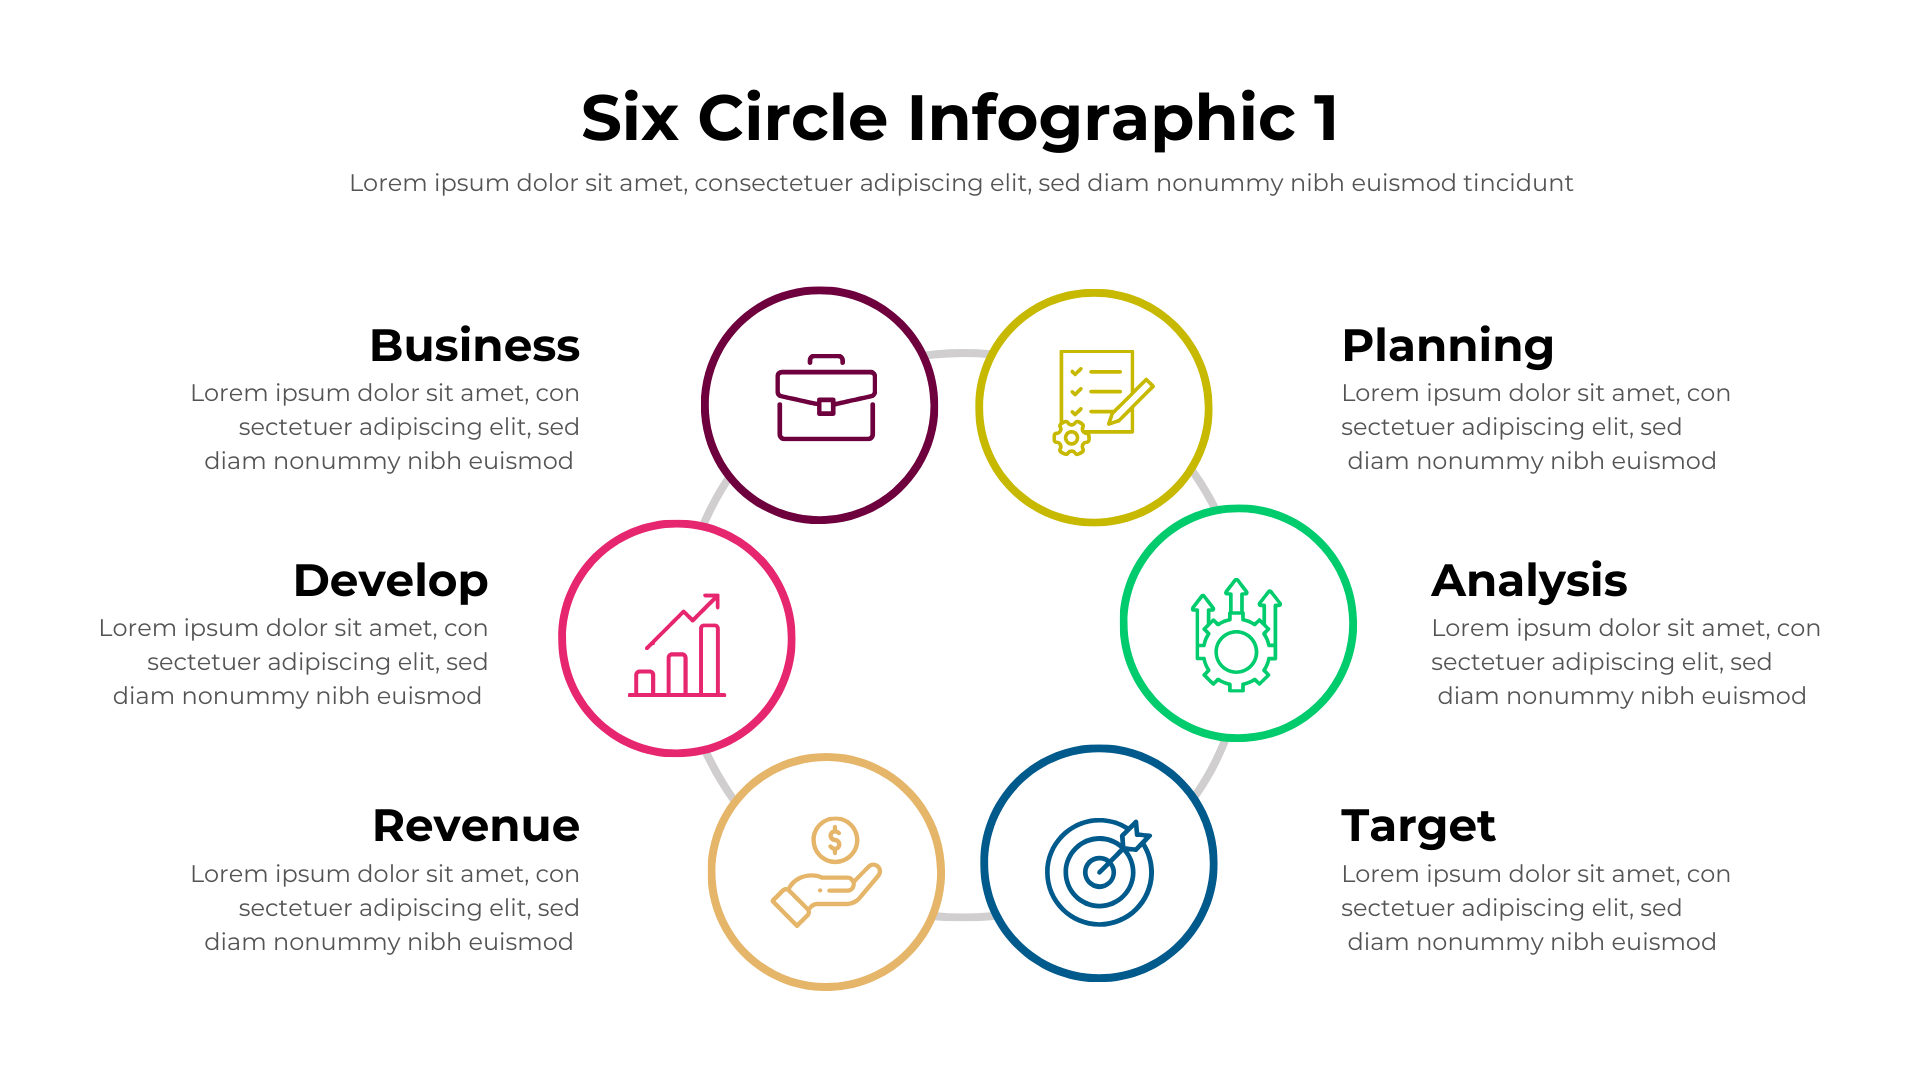
6 Circle Infographic Template
Simplify complex information with this visually engaging 6 Circle Infographic Templates. The clean, minimalist circular designs allow you to highlight up to 6 key data points or statistics in a memorable format your audience will understand and recall. You can use this 6 section circle infographic for displaying stats over six months or quarters, a six-step methodology, top six rankings, and for any presentations. When you must clearly communicate six key messages or data stories, this editable six circle infographic template will provide an organized, aesthetically pleasing solution.
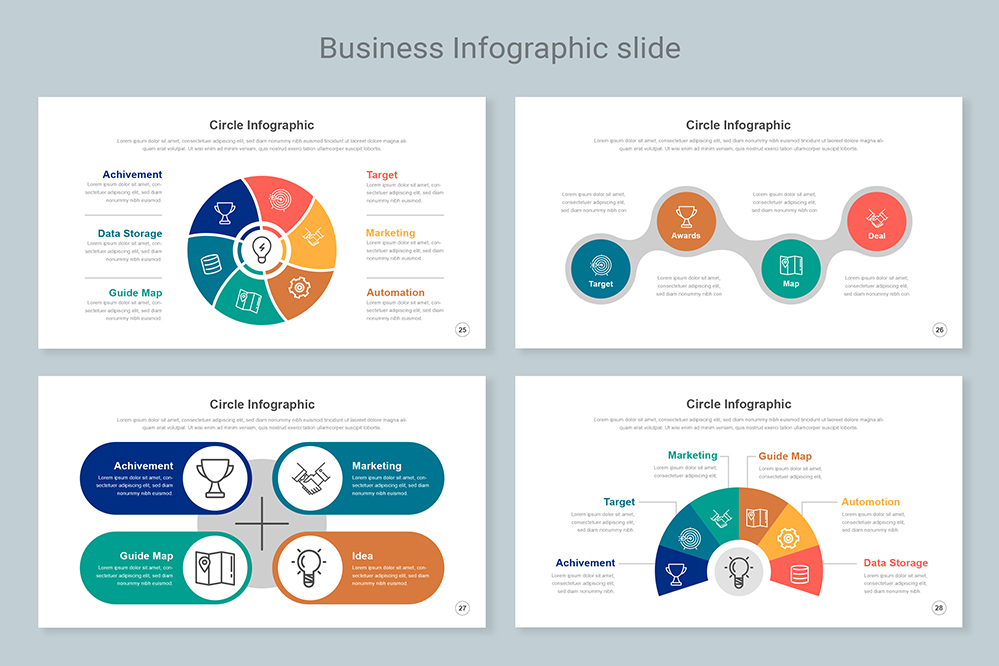
Circle Arrow Infographic Template
For showcasing a step-by-step process or methodology, Circle Arrow Infographic Templates are excellent choice. The circular layout displays each step in its own wedge segment, with arrows connecting the pieces to demonstrate flow. This intuitive format is great for breaking down workflows, production cycles, timelines, how-to’s, and more. Keep text simple in each step so the visual can breathe. When you need to map out a clear sequence, the circular arrow infographic will guide your audience through the information in an engaging, memorable way.
![]()
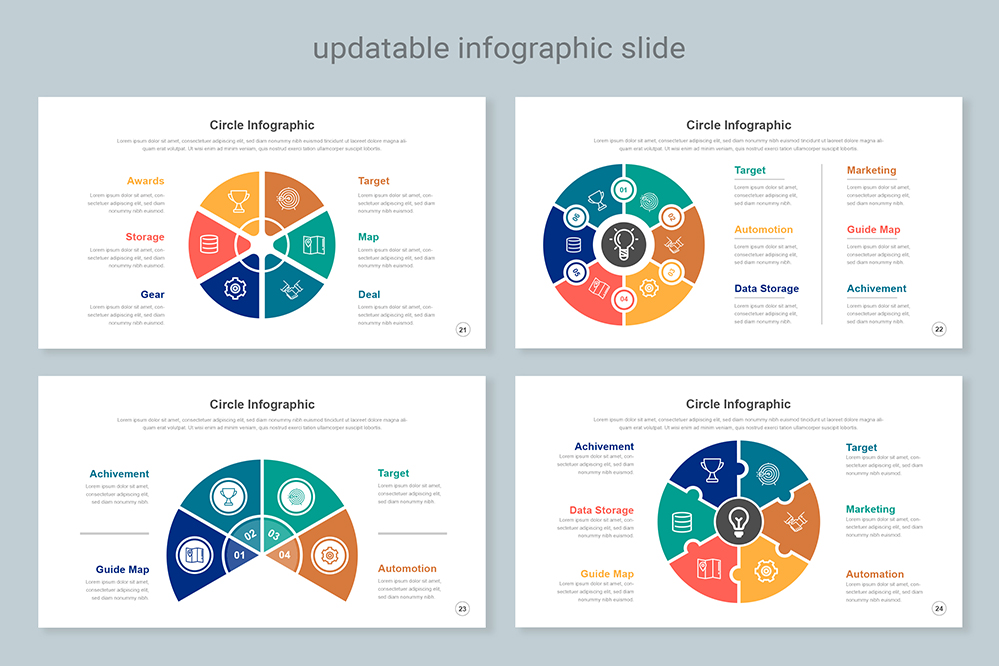
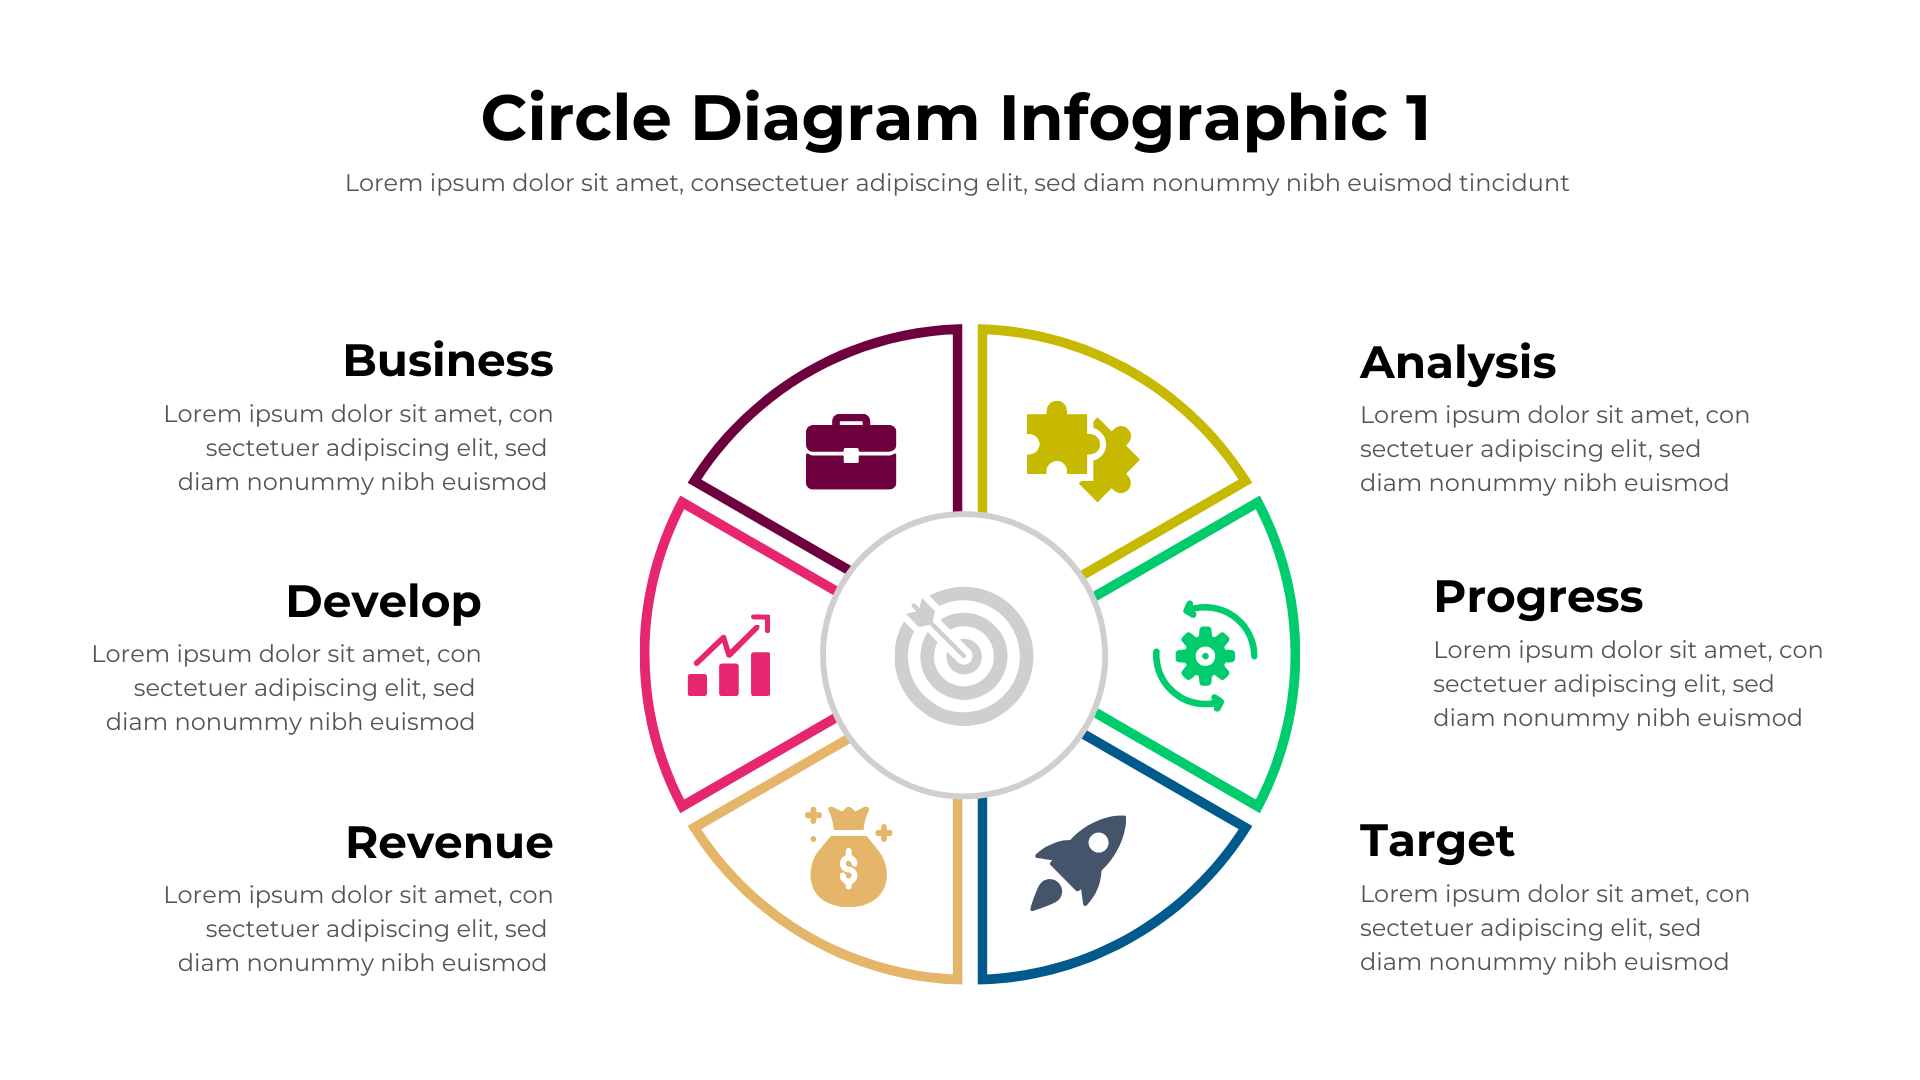
Circle Diagram Infographic Template
The Circle Diagram Infographic Template delivers a flexible canvas to map interconnected elements in a circular layout. Use this editable circular diagram Infographic to showcase relationships, highlight sequences, compare metrics, SaaS metrics, Explain scientific processes or cycles, Product features and benefits, and more. Bring your information to life with this versatile circle diagram infographic. Easily customize to create polished, professional graphics that organize key points in a logical circular format.
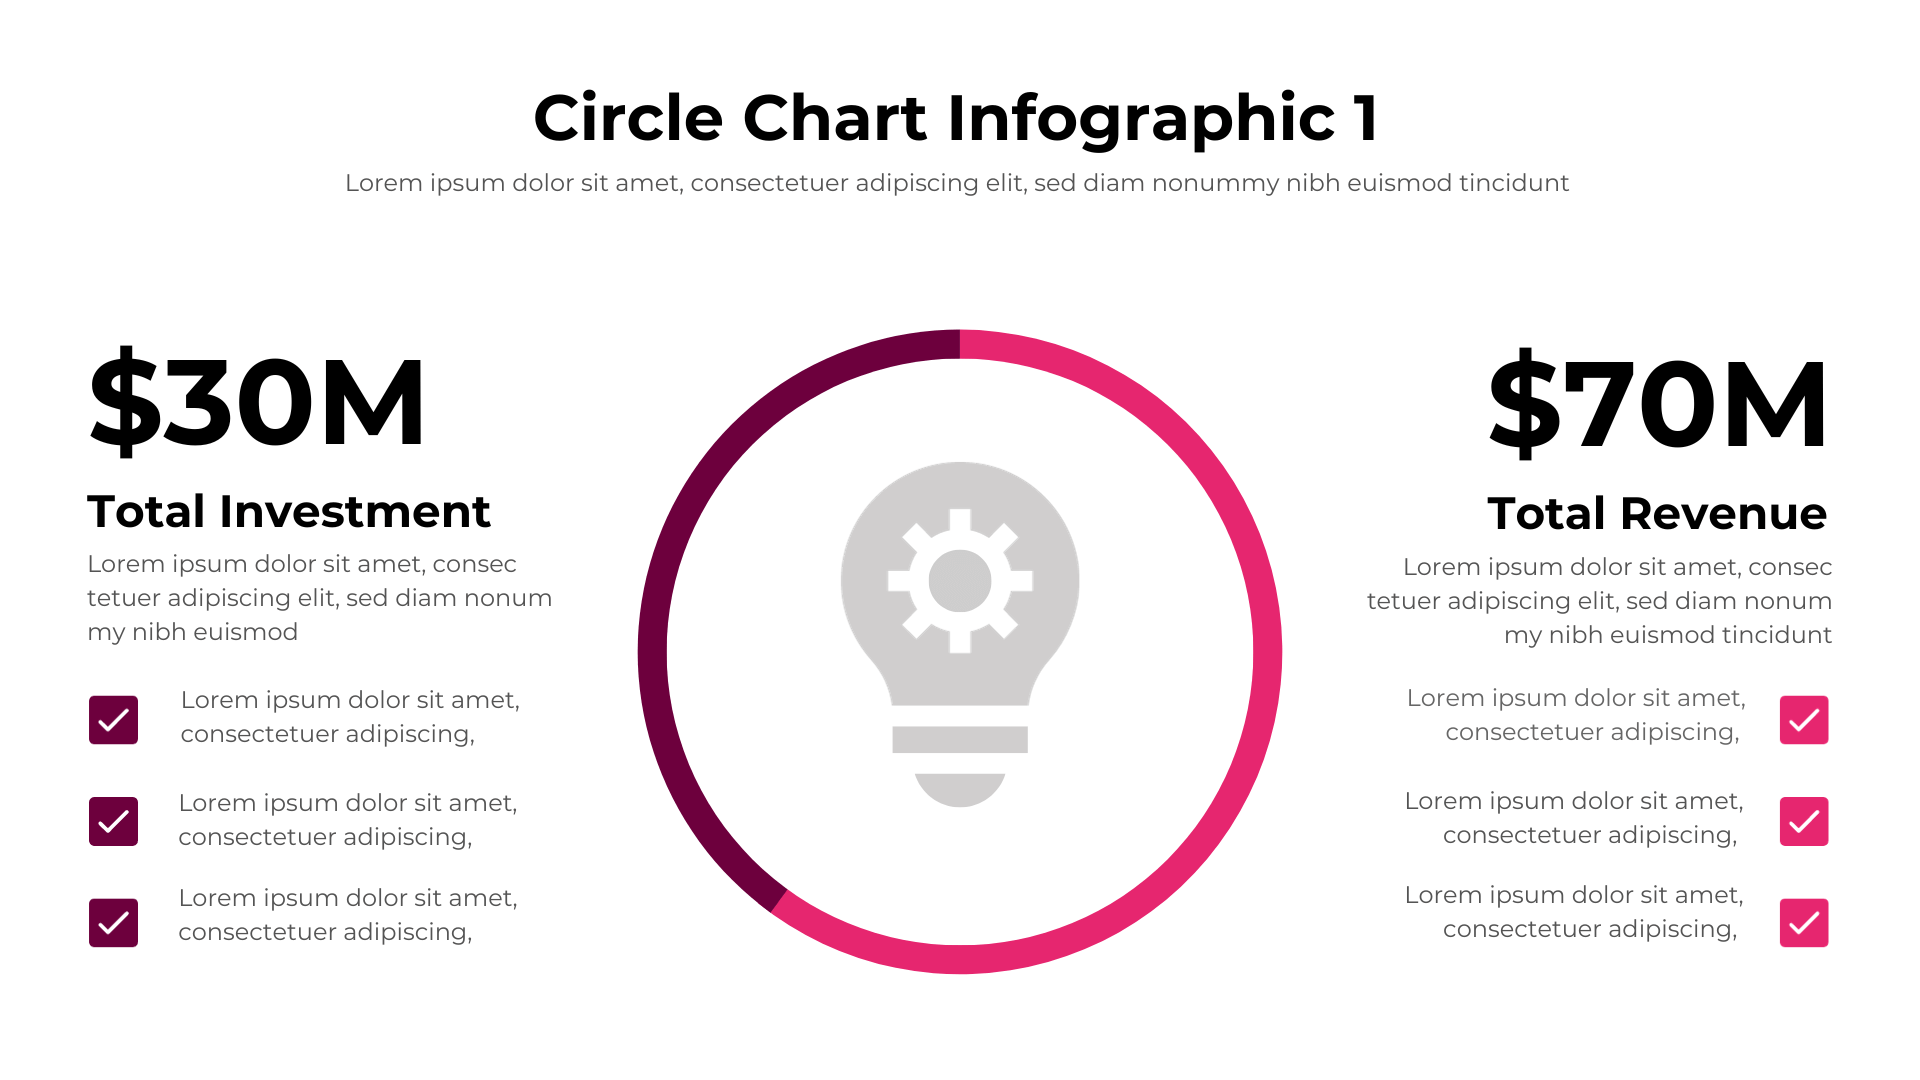
Circle Chart Infographic Template
Communicate insights clearly with our fully customizable Circle Chart Infographic Template. Easily create professional and visually appealing circle charts to compare metrics, highlight trends, explain concepts, tell data stories, and inform your audience. Made for PowerPoint, Google Slides, Keynote, Illustrator and Canva, this time-saving template enables you to quickly add your own data, images and branding to produce on-brand circle charts in minutes. Whether you need a business presentation, marketing graphic, educational resource or sharable data visualization, this versatile template helps you rapidly generate polished infographics that engage audiences and present your data effectively.
Key Features and Benefits
This expansive circle infographic template collection delivers:
- Professionally designed circle infographic layouts and styles
- Modern and minimalist designs
- Full and easy editability and customization
- One-click downloadable PPTX files
- Editable in PowerPoint, Keynote, Google Slides, Illustrator, and Canva
- Optimized for both digital and print presentations
- Commercial licensing included
- Mix, match, and insert desired visuals
- Iconography encompassing diverse subjects
- Color-coded templates
- Arrows demonstrating flow
Presenters, marketers, educators, and designers can use all of the professional circle infographics to create engaging presentations. The broad selection ensures finding an ideal circle infographic design, aesthetics, and configuration.
Examples of Use These Infographics
The Circle Infographics can be used for work, education, and personal purposes. Here are some examples of how you could use these templates effectively:
Business Presentations
- Showcase elements of a business model
- Map core activities in a workflow process
- Highlight milestones in a product roadmap
- Track monthly SaaS metrics
- Display employee onboarding steps
Marketing Campaigns
- Map stages in the buyer’s journey
- Provide product feature overview
- Construct cohesive brand messaging
- Analyze campaign results
- Track growth metrics
Educational Resources
- Illustrate steps in a science experiment
- Map key events in history
- Display grammar rules
- Show math principles
- Illustrate cycle of sleep and many more
How to Download and Customize This Circle Infographics
Follow these simple steps to download and customize it to use:
- Download Template
Sign up or log in to Mightyslide and subscribe to any of our plans, then click on Get Full Access to instantly download the files. Files are available for PowerPoint, Keynote, Google Slides, Illustrator, and Canva.
- Design the Infographic
Customize the templates by adding your own text, images, logos, and color scheme. Edit the infographic to match your brand and message.
- Fill in Each Step
In the infographic step, include the title and details for each stage. Simplify complex information into concise steps.
- Visualize Your Data
Enhance your infographic by including statistics, charts, graphs, icons, and other visual elements.
- Export
Make any last edits to colors, fonts, or formatting. Export your completed infographic in high resolution for use in any presentation software.
- Present and Share!
Incorporate your infographic into presentations, blog posts, brochures, ads, and anywhere you want.
Compatibility
This Infographic is fully customizable and compatible with the following programs:
- Microsoft PowerPoint
- Apple Keynote
- Google Slides
- Adobe Illustrator
- Canva
No matter your operating system, you can fully tailor the templates to match your personal brand and style needs. The vector-based graphics will also retain quality across any software or device.
Bring data to life with our customizable circle infographic templates, available in widescreen 16:9 ratios for versatility. Download this infographic to present your data in a creative and informative way.
Share Now!
Purchase
$0.00
Compatibility
Unlock this Template