KPI Diagram Infographic Templates
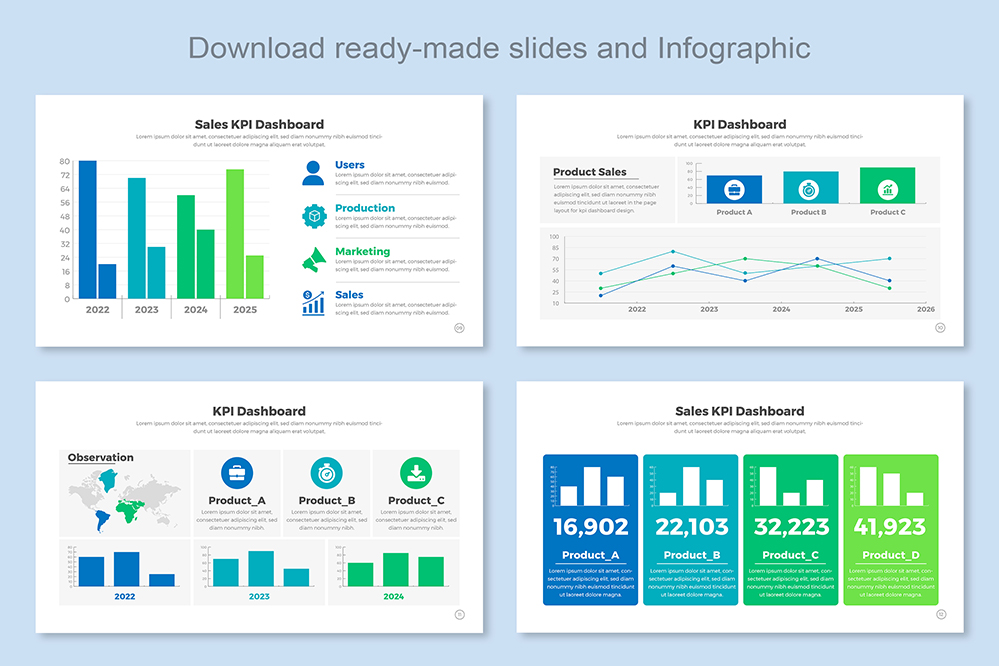
Elevate your presentation with our brand-new KPI Diagram Infographic Templates! Easily create stunning infographics to bring your presentation to life and make your audience engaged. Our templates are well-designed and provide you with a vast selection of customizable options to get the most out of your data. With our Infographic Templates, you can quickly and easily create infographics that stand out from the crowd. Start customizing today and make your visual presentations look professional and attractive.
Are you looking for a way to take your presentations up a notch? Look no further than our brand-new KPI Diagram Infographic Templates! These stunning templates are the perfect way to add visual appeal and clarity to your presentations, making your data easier to understand and more memorable. With our templates, you can quickly create attractive, informative infographics that are sure to impress. So, what are you waiting for? Get our Infographic Templates today and make your presentations stand out!
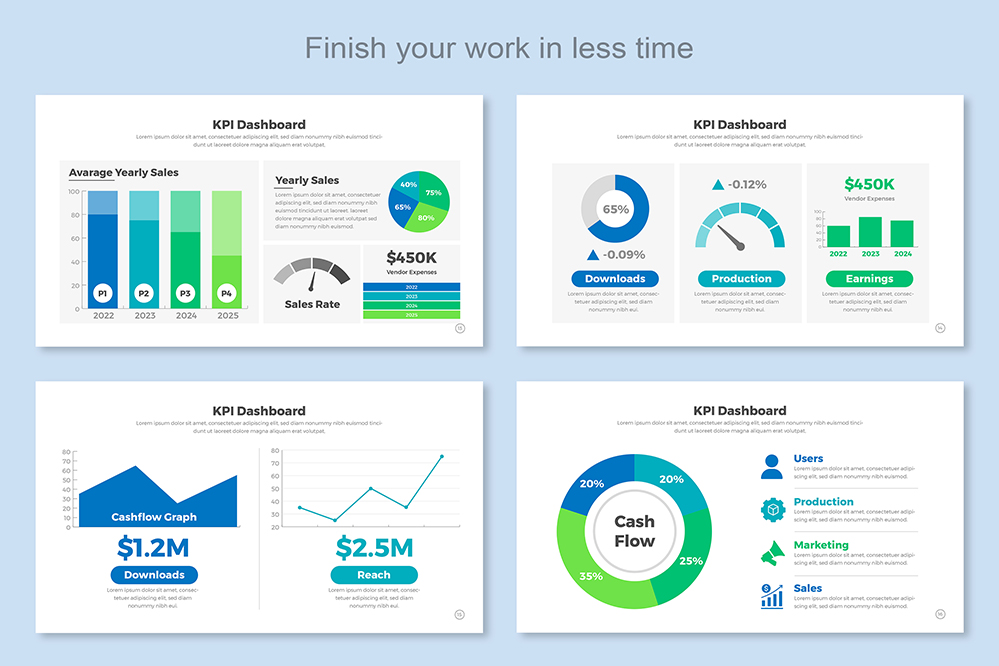
KPI Diagram Infographic Templates – the perfect way to visually illustrate complex data sets and draw in your audience. Our templates are user-friendly, easy to use, and designed to help you present your information in a visually engaging way. From pie charts to bar graphs, our professionally-designed templates offer a variety of ways to communicate your data. With these templates, you can easily create beautiful infographics to share with your audience and help them understand your data in an intuitive and interesting way. So don’t wait any longer – make your data stand out with our Infographic Templates!
These fully customizable templates are the perfect way to visualize your data in an attractive and easy-to-understand way. Whether you’re a professional or a novice visual creator, these templates make it easy to create stunning infographics in minutes.
Choose from a variety of professionally designed templates and customize them with your own data and information. With our KPI Diagram Infographic Templates, you can create high-quality infographics that will impress your audience and help you convey your message in an effective way.
Start creating beautiful infographics with our KPI Diagram Infographic Templates today!
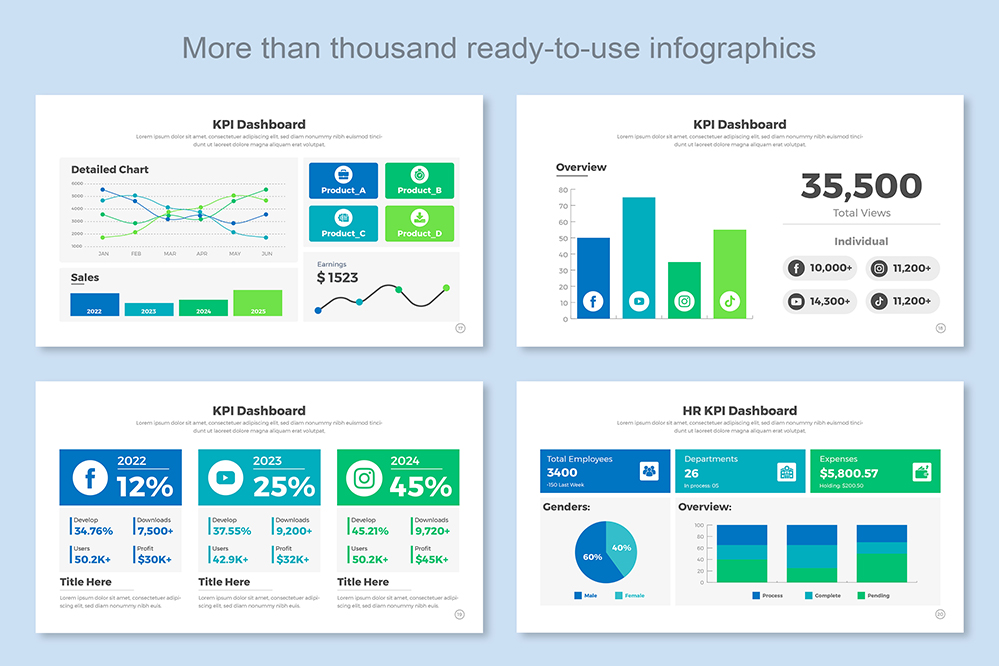
These awesome templates make it easy to create high-quality, eye-catching infographics to showcase your Key Performance Indicators. Perfect for businesses looking to visualize their data in an impactful way, the templates come with a range of customizable options to suit any project. From color palettes to chart types, you can create an infographic that perfectly captures your KPI information. Add your own data, or use our pre-filled examples, to create a stunning visual representation of your success! Get started now with these KPI Diagram Infographic Templates.
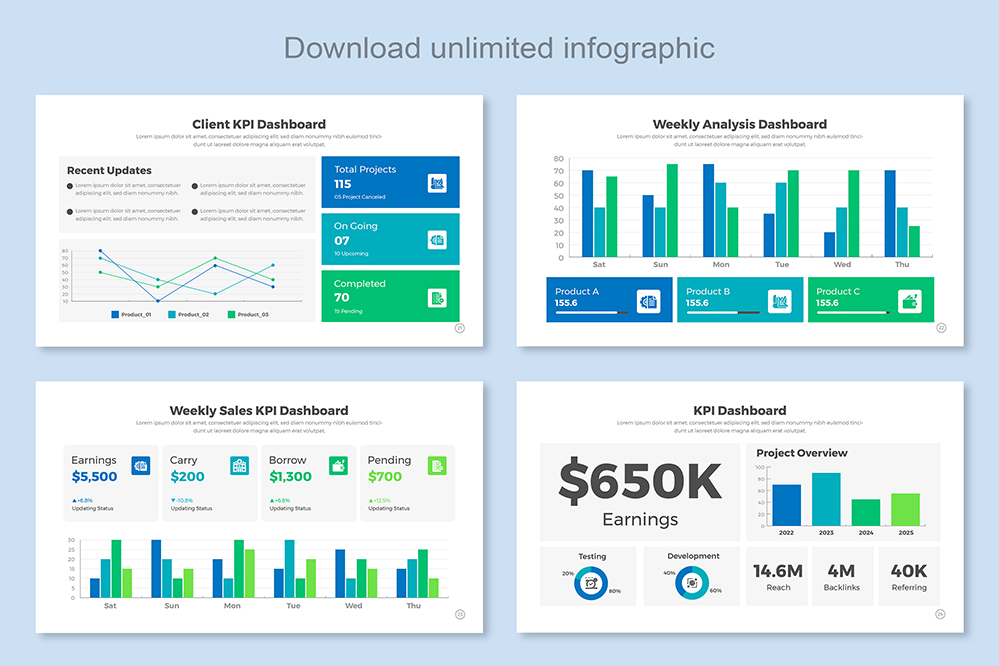
Bring your data to life with beautiful and informative infographics! Our templates make it easy to create stunning visuals that showcase all of your important data. They’re perfect for sharing KPI information with your team and stakeholders in an engaging, visual way. Plus, they’re easy to customize, so you can make them your own. Get creative with your data and make the most of your KPI Diagram Infographic Templates!
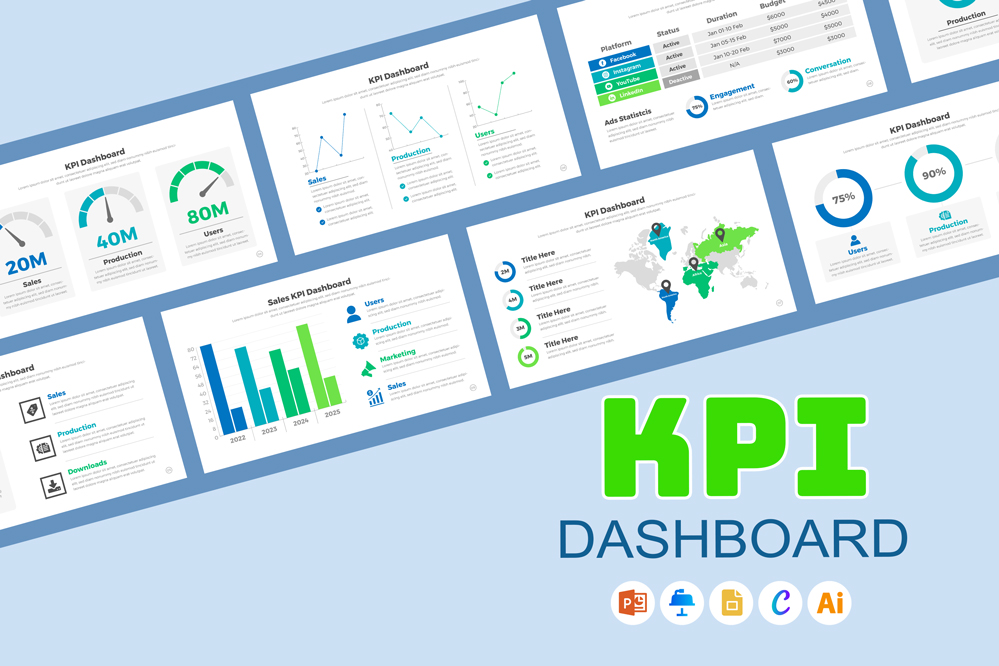
Compatibility:
- PowerPoint File
- Apple Keynote File
- Google Slides
- Editable Illustrator EPS File
- Canva Format
Share Now!
Purchase
$0.00
Compatibility
Unlock this Template
KPI Diagram Infographic Templates
mighty-infographics
Related Products