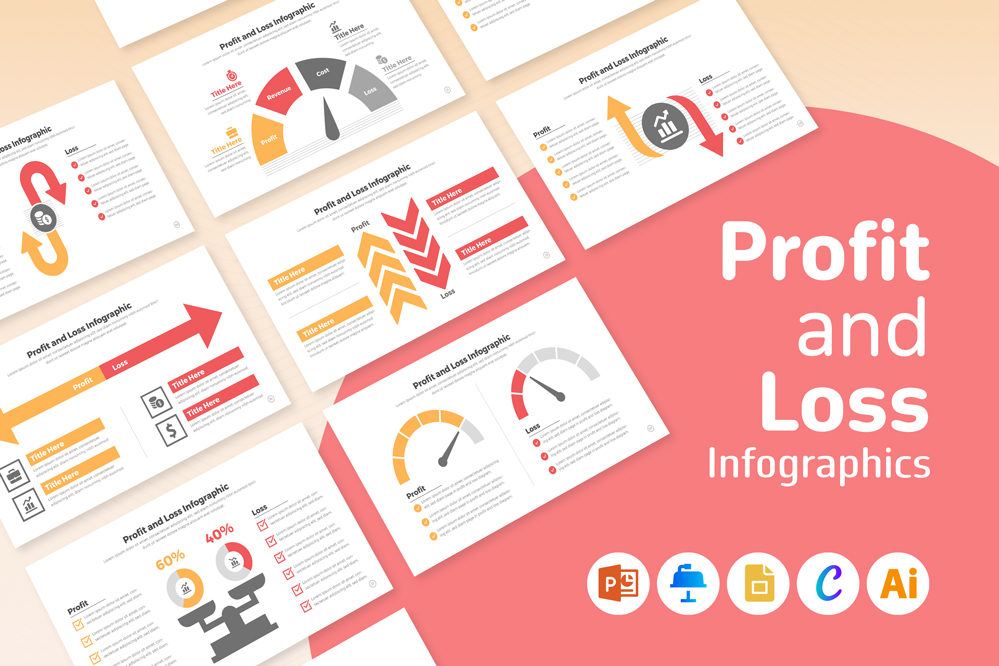
Profit and Loss Infographic Templates
Profit and Loss Infographic Templates: A Comprehensive Guide to Different Versions
In today’s fast-paced business environment, visualizing financial data effectively is crucial. Profit and loss statements are vital for understanding a company’s financial health, and presenting this information in an engaging and clear manner can make all the difference. Infographic templates offer a compelling way to showcase profit and loss data, making it easier for stakeholders to grasp key insights at a glance. This guide will walk you through the various versions of profit and loss infographic templates available for Microsoft PowerPoint, Keynote, Google Slides, Canva, and Adobe Illustrator. Each platform offers unique features and benefits that can enhance your financial presentations.
Understanding Profit and Loss Infographics
- Definition and Importance: Profit and loss infographics provide a visual representation of a company’s financial performance over a specific period. They typically include key metrics such as revenue, expenses, and net income, helping stakeholders quickly understand financial trends and outcomes.
- Benefits: Using infographics simplifies complex financial data, highlights trends and anomalies, and aids in decision-making.
Share Now!


