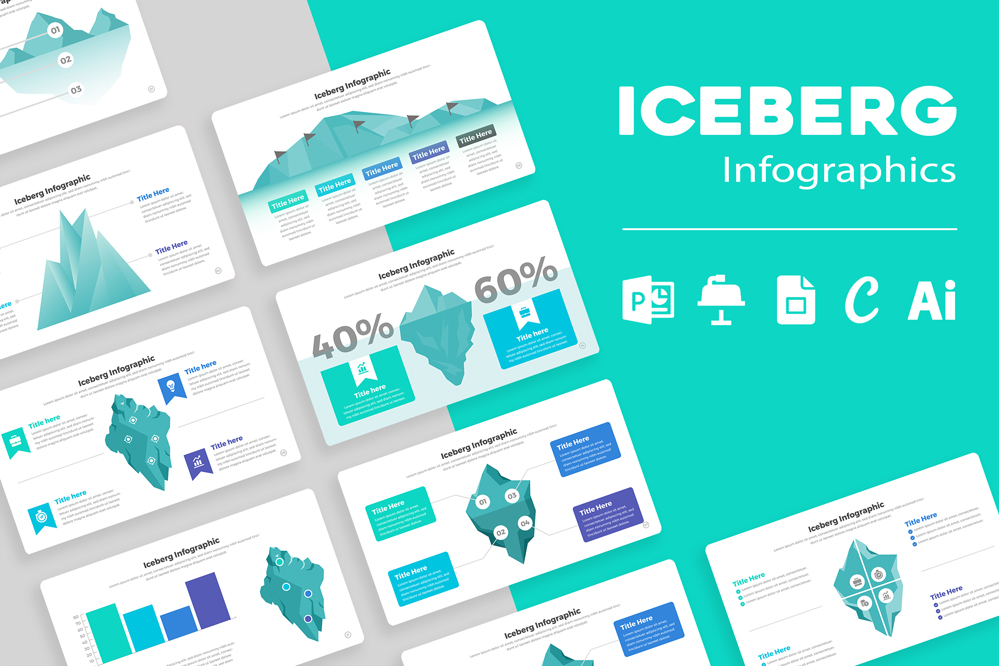
Iceberg Infographic Templates
Iceberg Infographic Templates: A Comprehensive Guide to Presentation Versions
Iceberg infographics are powerful tools for visualizing complex concepts, illustrating hidden depths, and presenting data in an engaging way. With their unique design that showcases only a fraction of the information on the surface while revealing more below, iceberg infographics can make your presentations both insightful and visually appealing. This guide will explore various versions of iceberg infographic templates available for Microsoft PowerPoint, Keynote, Google Slides, Canva, and Adobe Illustrator, helping you choose the best format for your needs.
Understanding Iceberg Infographics
They are particularly useful in scenarios where you want to emphasize the depth and underlying factors of a subject. Common uses include:
- Data Analysis: Showcasing the visible data alongside deeper insights or underlying issues.
- Project Management: Illustrating the surface accomplishments versus the challenges or risks hidden beneath.
- Strategic Planning: Highlighting the visible strategy versus the underlying factors that influence it.
Share Now!


