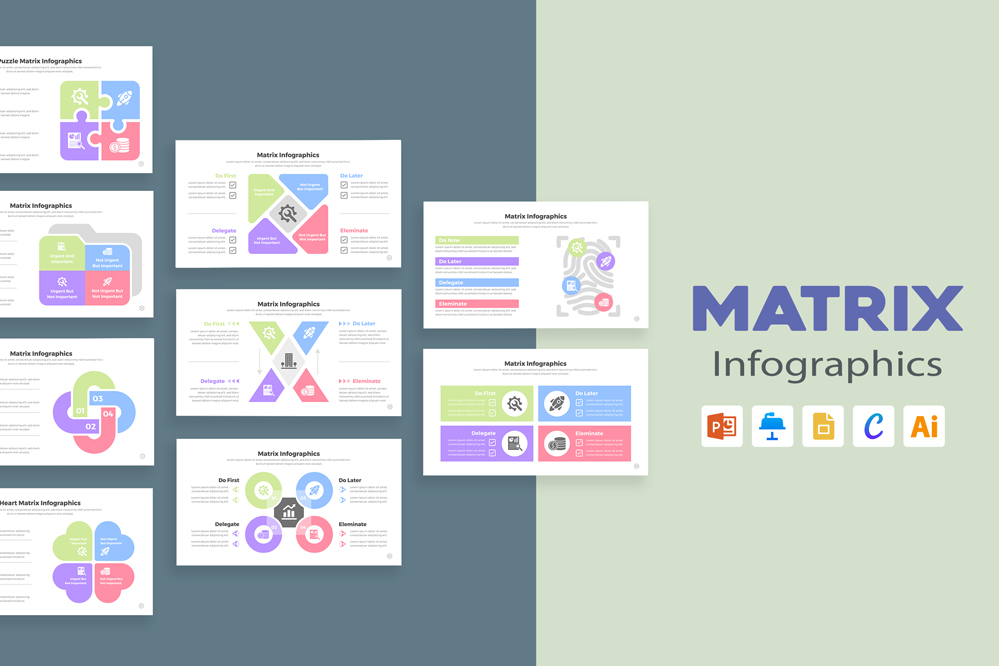
Matrix Infographic Templates
The Ultimate Guide to Matrix Infographic Templates: Versatility Across Formats
In the world of data visualization, matrix infographics stand out as a versatile and effective way to present complex information. Whether you’re comparing multiple variables, displaying relationships, or organizing data into a structured format, matrix infographics can simplify and clarify your message. This article delves into the benefits of matrix infographics, how to leverage templates in various formats, and best practices for creating compelling visuals.
What is a Matrix Infographic?
A matrix infographic is a visual representation of data arranged in a grid or matrix format. These infographics are particularly useful for:
- Comparative Analysis: Showing differences and similarities across multiple categories.
- Relationship Mapping: Displaying connections and interactions between different elements.
- Data Organization: Structuring information for easy interpretation and analysis.
Benefits of Matrix Infographics
- Clarity and Organization: Matrix infographics provide a clear structure that makes it easier to understand complex data. By organizing information in a grid, users can quickly identify patterns and relationships.
- Versatility: Matrix infographics are adaptable to various types of data, from business metrics to academic research. They can be used in multiple industries, including finance, marketing, and education.
- Enhanced Visual Appeal: With the right design, matrix infographics can be visually engaging, making data more accessible and memorable.
Share Now!


