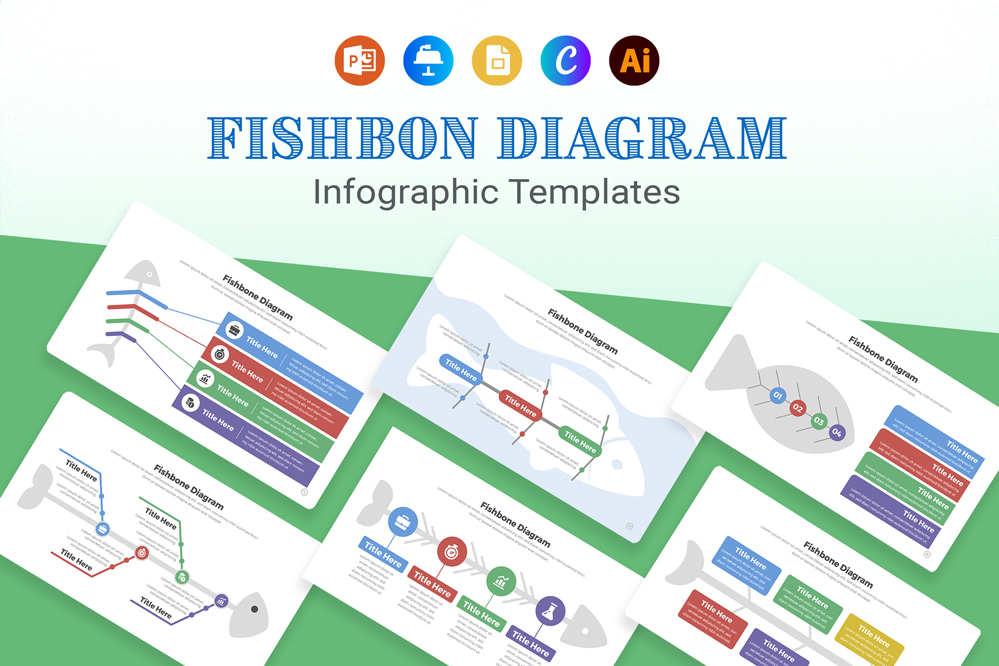
Fishbone Diagram Infographic Templates
Fishbone Diagram Infographic Templates: Elevate Your Presentations with Versatile Solutions
In the realm of visual communication, the Fishbone Diagram, also known as the Ishikawa Diagram, stands out as an invaluable tool for identifying and analyzing the root causes of a problem. Whether you’re a business analyst, project manager, or team leader, using a well-designed Fishbone Diagram can significantly enhance your presentations and problem-solving sessions. This article delves into the best Fishbone Diagram infographic templates available across different platforms, including Microsoft PowerPoint, Keynote, Google Slides, Canva, and Adobe Illustrator.
Understanding the Fishbone Diagram
A Fishbone Diagram is a cause-and-effect diagram that visually represents the potential causes of a specific problem. Its structure resembles a fish’s skeleton, with the problem at the head and various causes branching out like bones. This diagram is particularly effective for:
- Identifying root causes of issues
- Improving problem-solving processes
- Enhancing team collaboration and brainstorming
Share Now!


