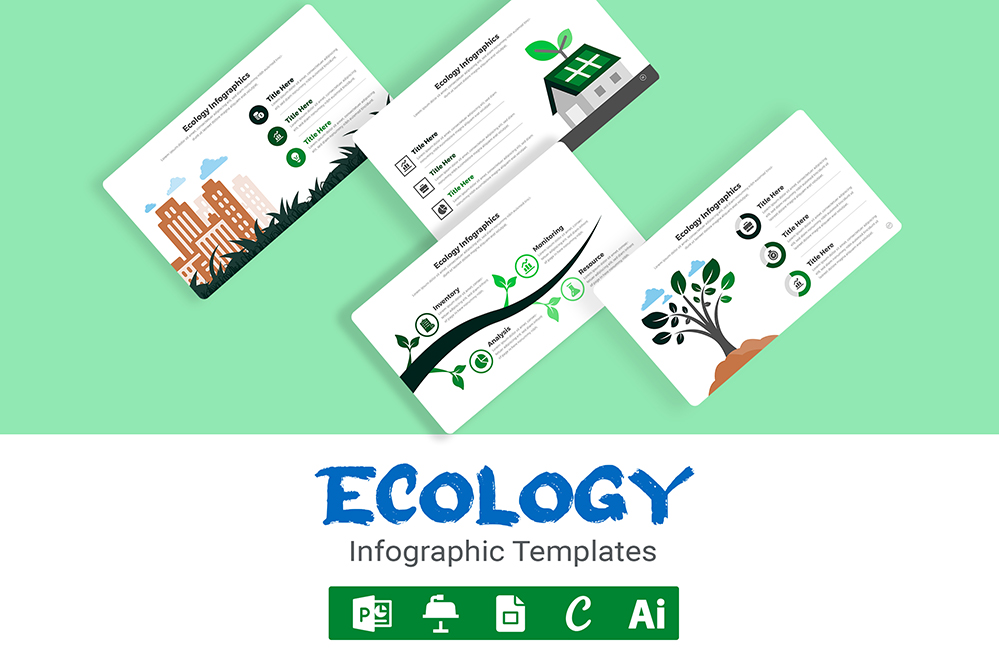
Ecology Infographic Templates
Transform Your Data with Stunning Ecology Infographic Templates
In the realm of environmental science and sustainability, conveying complex data clearly and engagingly is crucial. Ecology infographic templates offer an effective solution, helping to visualize ecological data, trends, and insights in a visually appealing way. Whether you’re a researcher, educator, or activist, using the right template can significantly enhance your presentations. This guide explores various Ecology Infographic Templates available in popular formats such as Microsoft PowerPoint, Keynote, Google Slides, Canva, and Adobe Illustrator. We’ll delve into their features, benefits, and how to choose the best one for your needs.
Why Use Ecology Infographic Templates?
Ecology infographic templates serve multiple purposes:
- Data Visualization: They simplify complex ecological data, making it accessible and understandable.
- Engagement: Visually appealing infographics capture attention and improve retention.
- Education: They aid in teaching concepts and data in a more interactive way.
- Communication: They help in effectively communicating research findings or advocacy messages to a broad audience.
Share Now!


