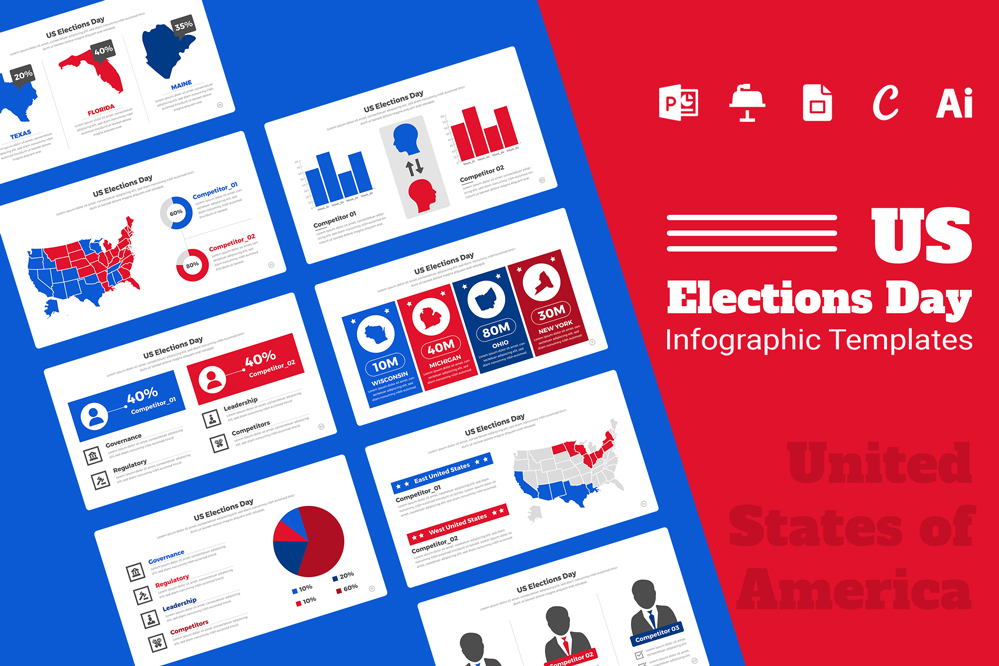
US Elections Infographic Templates
Comprehensive US Elections Infographic Templates: Multi-Format Solutions for Engaging Presentations
The United States elections are pivotal events that shape the future of the country. Whether you’re a political analyst, educator, or media professional, conveying election data effectively is crucial. US Elections Infographic Templates provide an efficient way to present complex information in a visually engaging manner. This article explores a comprehensive range of infographic templates available in multiple formats, including Microsoft PowerPoint, Keynote, Google Slides, Canva, and Adobe Illustrator. These templates are designed to help you craft professional, eye-catching presentations that can be tailored to your audience’s needs.
Why Use Infographics for US Elections?
Infographics are a powerful tool for presenting data in a digestible format. During elections, vast amounts of data, such as voter demographics, election results, and campaign finances, need to be communicated effectively. Infographics allow you to visualize this information, making it easier for your audience to understand and retain. They help to break down complex statistics and trends into clear, concise visuals, enhancing engagement and comprehension.
Share Now!


