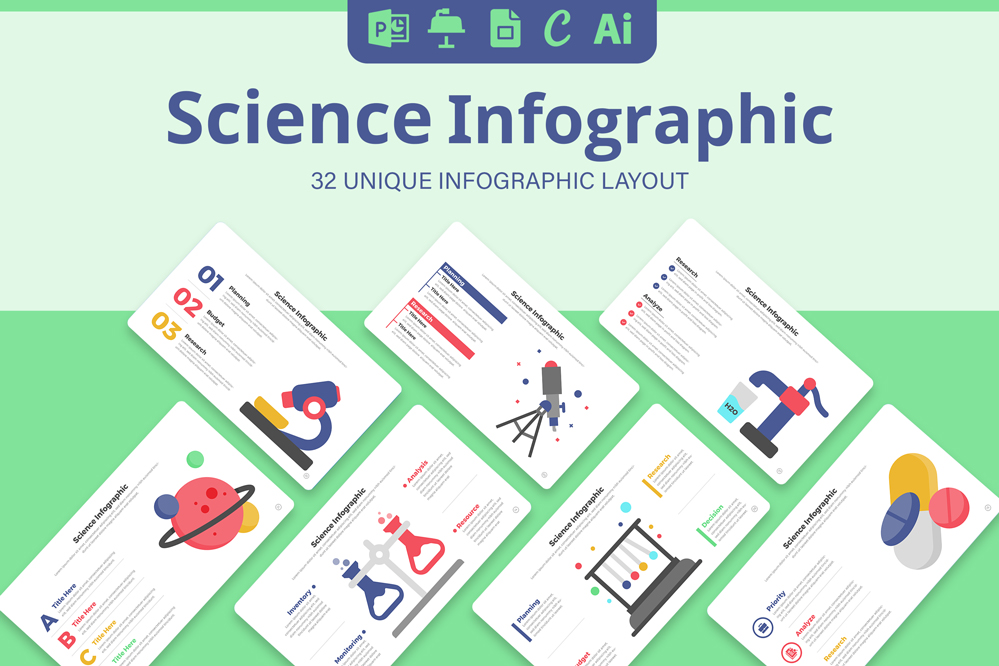
Science Infographic Templates
Comprehensive Guide to Science Infographic Templates
In the fast-paced world of scientific communication, clarity and visual appeal are key to making complex information accessible and engaging. Science infographics are powerful tools that can simplify intricate data, convey compelling stories, and enhance the impact of your scientific presentations. Whether you’re a researcher, educator, or science communicator, having the right template can make all the difference. In this guide, we’ll explore a range of science infographic templates available in various formats, including Microsoft PowerPoint, Keynote, Google Slides, Canva, and Adobe Illustrator, ensuring you have the flexibility to create stunning visuals that resonate with your audience.
Why Science Infographics Matter
Science infographics are more than just visually appealing designs—they are essential tools for effective communication. In this section, we’ll discuss the significance of infographics in the scientific community, including their ability to:
- Simplify complex concepts: Science often involves intricate data and theories. Infographics break down these complexities into easily digestible visuals, making it easier for your audience to understand.
- Enhance engagement: Visuals are more engaging than plain text, and science infographics can capture your audience’s attention and keep them interested.
- Improve retention: Studies have shown that people are more likely to remember information presented in a visual format. Infographics help reinforce key points and make your message more memorable.
- Promote accessibility: By presenting data visually, you make it accessible to a broader audience, including those who may not have a deep understanding of the subject matter.
Share Now!


