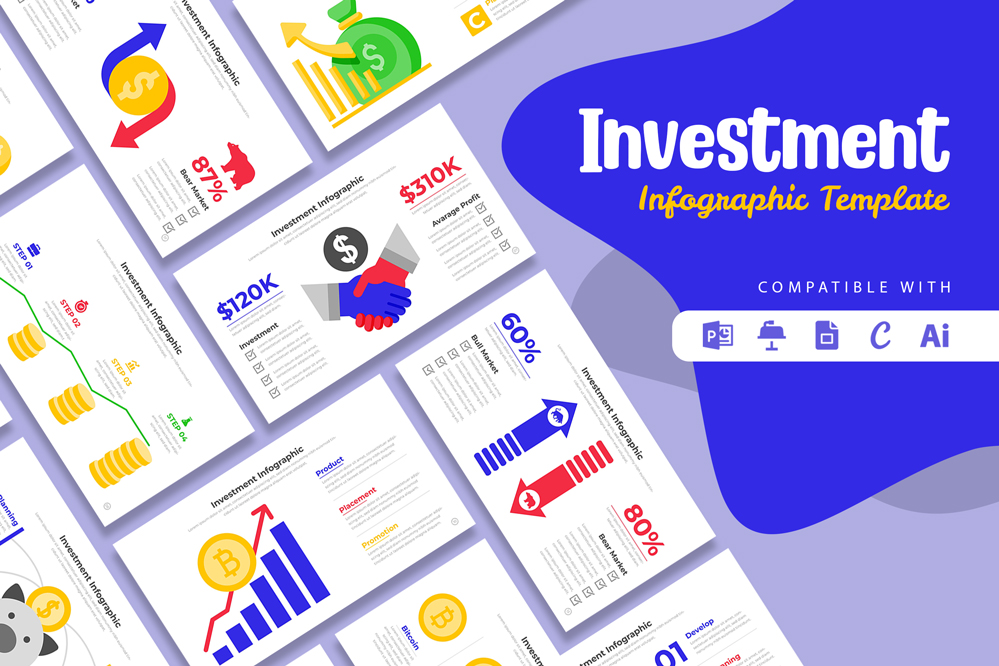
Investment Infographic Template
Investment Infographic Template: A Comprehensive Guide for Presentations
Investment infographics are a powerful tool for communicating complex financial data and strategies in a visually engaging manner. Whether you’re presenting to potential investors, stakeholders, or team members, a well-designed infographic can make your investment opportunities clearer and more compelling. In this article, we will explore various versions of investment infographic templates, including Microsoft PowerPoint, Keynote, Google Slides, Canva, and Adobe Illustrator. We’ll discuss their features, benefits, and how to choose the best format for your needs.
Understanding Investment Infographics
Investment infographics are designed to present financial data, investment opportunities, and market trends in a clear and engaging way. They help simplify complex information through visual elements such as charts, graphs, icons, and data visualizations. Key elements to include are:
- Investment Overview: A summary of the investment opportunity.
- Market Analysis: Insights into market trends and conditions.
- Financial Projections: Data on expected returns, risks, and growth.
- Key Metrics: Important indicators of investment performance.
- Visual Data Representations: Charts, graphs, and other visual aids.
Share Now!


