


Circle Diagram Infographic


Mastering the Circle Diagram Infographic: Versatile Templates for All Your Presentation Needs
In the realm of visual communication, circle diagrams stand out as powerful tools for conveying complex information in a clear and engaging manner. Whether you’re crafting a business presentation, academic report, or marketing material, a well-designed circle diagram infographic can make your content more impactful and memorable. In this article, we explore how to create effective circle diagram infographics using a variety of tools: Microsoft PowerPoint, Keynote, Google Slides, Canva, and Adobe Illustrator. Each platform offers unique features and capabilities, ensuring that you can choose the best one for your needs.
Main Points
- Understanding Circle Diagrams
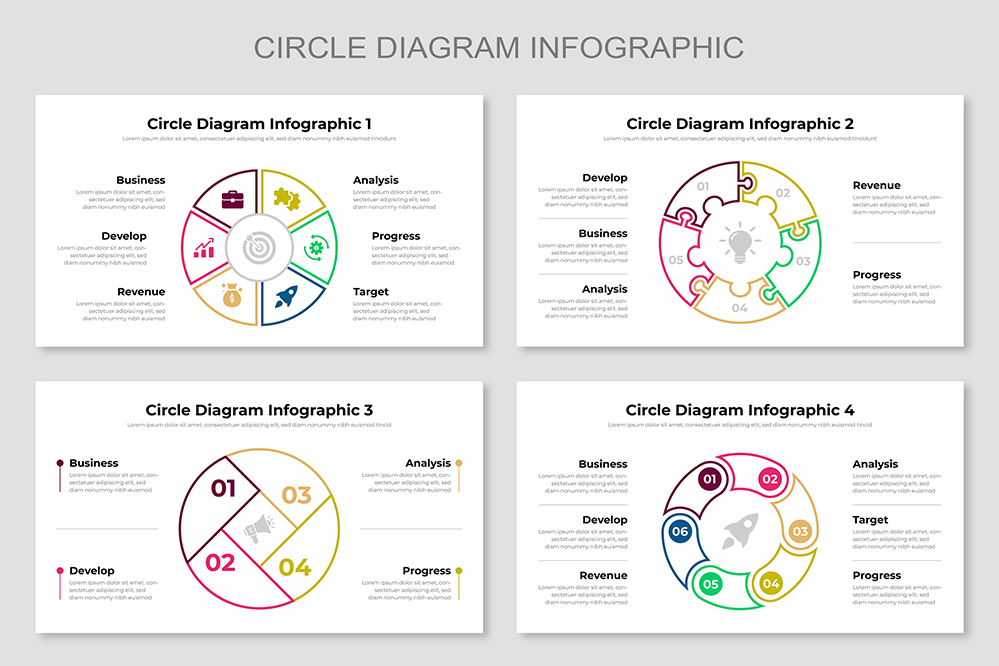
Circle diagrams, often referred to as pie charts or radial diagrams, are used to represent data or concepts that are part of a whole. They are particularly useful for illustrating proportions, percentages, and relationships. The visual appeal of circle diagrams lies in their simplicity and the ease with which they can communicate complex information.
Share Now!
Circle Diagram Infographic
circle-infographics
Related Products


