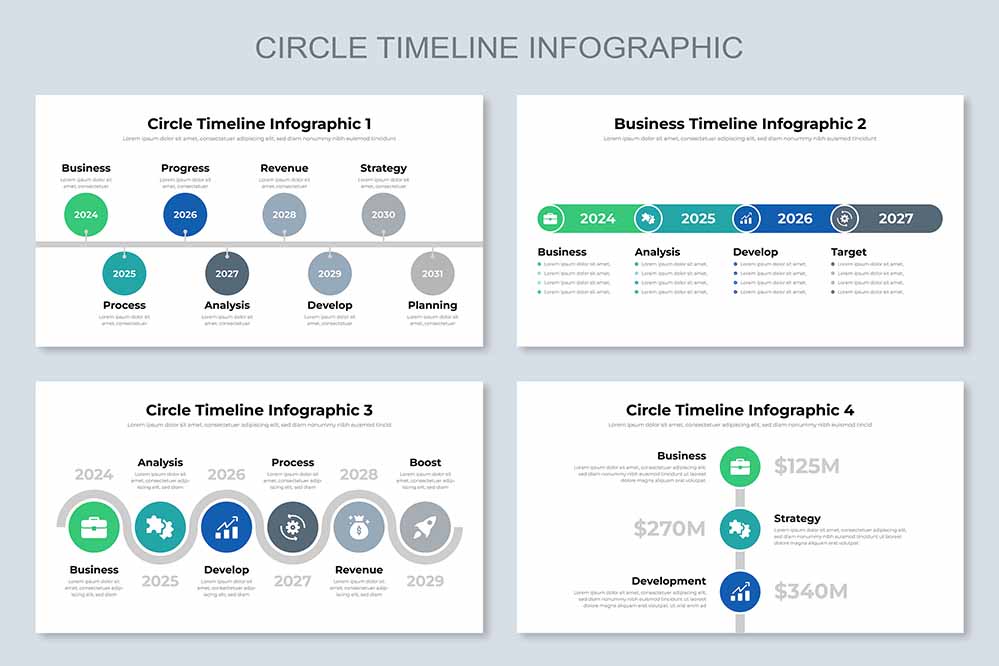
Circle Timeline Infographic
The Ultimate Guide to Circle Timeline Infographics: Templates for Every Platform
Circle timeline infographics are a powerful way to present chronological events, processes, or milestones in a visually appealing and easy-to-understand format. Whether you’re a designer, marketer, or project manager, having the right template can make your timelines more engaging and informative. This article explores various Circle Timeline Infographic templates available for Microsoft PowerPoint, Keynote, Google Slides, Canva, and Adobe Illustrator, helping you choose the best option for your needs.
A circle timeline infographic is a visual representation of events or processes arranged in a circular format. This design allows you to showcase a series of milestones or phases in a non-linear, visually engaging manner. Circle timelines are especially useful for illustrating cyclical processes, historical events, or project phases.
Benefits of Using a Circular Format:
- Visual Appeal: The circular layout is visually striking and helps capture attention.
- Clarity: It effectively illustrates chronological progression and relationships between events.
- Flexibility: Suitable for various types of content, from business projects to historical timelines.
Share Now!


