


Skill Gap Analysis Infographic


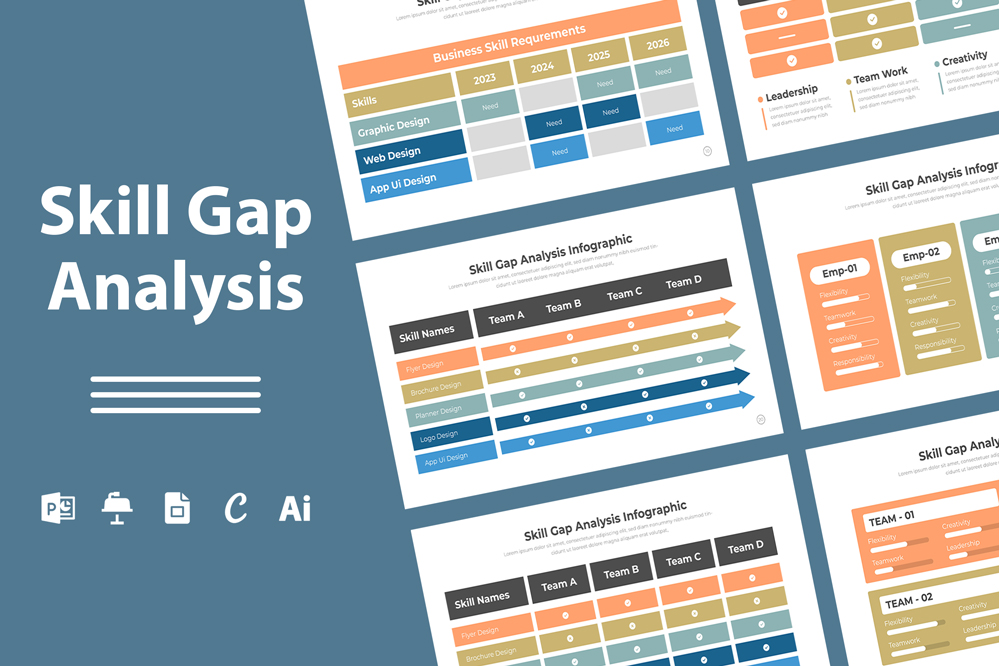
Skill Gap Analysis Infographic Template: Comprehensive Tools for Effective Presentations
In today’s rapidly evolving job market, understanding and addressing skill gaps within an organization is crucial for maintaining a competitive edge. A Skill Gap Analysis allows businesses, educational institutions, and HR departments to identify areas where their team members lack the necessary skills and provides a roadmap for targeted development. But conveying this analysis in a clear and engaging manner can be challenging. That’s where a well-designed Skill Gap Analysis Infographic comes into play.
This article explores the importance of Skill Gap Analysis, the benefits of using infographics for this purpose, and introduces a versatile Skill Gap Analysis Infographic Template available in various file formats, including Microsoft PowerPoint, Keynote, Google Slides, Canva, and Adobe Illustrator.
What is Skill Gap Analysis?
Skill Gap Analysis is a strategic process that identifies the difference between the skills required for a specific job or task and the actual skills possessed by employees or students. By conducting a skill gap analysis, organizations can pinpoint areas that need improvement and develop targeted training programs to bridge these gaps. This process is essential for ensuring that the workforce is equipped with the necessary skills to meet current and future demands.
The Power of Skill Gap Analysis Infographics
Infographics are particularly effective in presenting the findings of a Skill Gap Analysis because they allow you to:
- Simplify Complex Data: Infographics can break down complex information into digestible visual elements, making it easier for your audience to grasp the key points of your analysis.
- Engage Your Audience: A well-designed infographic is more likely to capture and hold the attention of your audience compared to text-heavy reports.
- Facilitate Decision-Making: By clearly presenting the gaps and the areas that need improvement, infographics can help stakeholders make informed decisions quickly.
- Enhance Retention: Visual elements in infographics help in better retention of information, ensuring that your audience remembers the critical points of your presentation.
Share Now!
Skill Gap Analysis Infographic
mighty-infographics
Related Products


