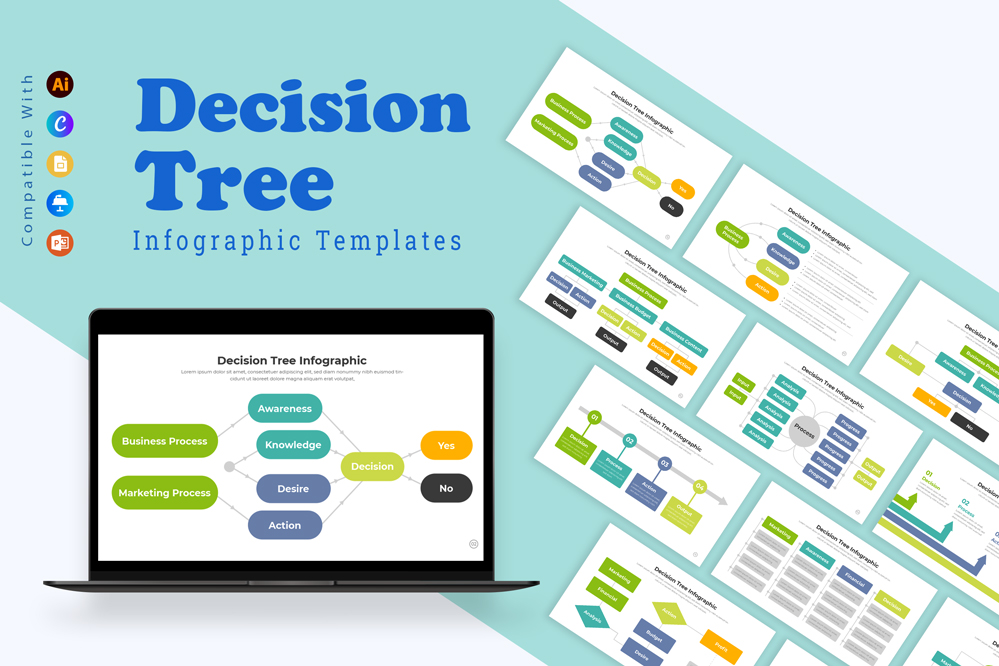
Decision Tree Infographic
Master the Art of Decision-Making: Decision Tree Infographic Templates for Every Platform
Editing a decision tree infographic involves several key steps, including updating content, changing colors, and understanding its practical applications. Here’s a detailed guide on how to edit a decision tree infographic and where it can be effectively utilized.
Open the Infographic File: Begin by opening the decision tree infographic in graphic design software like PowerPoint, keynote, or Adobe Illustrator. Ensure you have access to the original file or a copy that allows for editing.
Editing Text:
- Click on the text boxes within the infographic to edit the content. Ensure the questions or decisions at each node (decision point) are clear and concise.
- Maintain consistency in font size, style, and color across all text elements. Adjust the text placement as needed to ensure it fits well within the design without overlapping other elements.
Modifying Shapes and Lines:
- Decision trees typically use boxes or circles to represent decision points and lines or arrows to show the flow between them.
- Adjust the thickness and style of lines or arrows to improve clarity or match the overall design.
Changing Colors:
- Colors are essential for differentiating between various branches or sections of the decision tree. To change colors: – Select the element (shape, line, or background) you want to recolor.
- Use the color picker tool to choose new colors. Consider using different colors for different decision paths to make the tree easier to navigate.
- Ensure the color scheme aligns with your brand guidelines or the overall theme. For instance, you might use a gradient or varying shades to indicate different levels of importance or stages in the decision process.
- Maintain high contrast between the text and background to ensure readability.
Incorporating Icons and Graphics:
- If the infographic includes icons or other graphics, ensure they are relevant to the decision points and paths. You can replace or update these by selecting and importing new icons.
- Make sure that any new graphics maintain a consistent style and are high resolution to avoid distortion.
Uses of a Decision Tree Infographic:
- Business Decision-Making: A decision tree infographic can be used to map out different business decisions, helping stakeholders visualize the outcomes of various options.
- Training and Education: Use decision trees in training materials to guide learners through complex processes or decision-making scenarios.
- Client Presentations: Present decision trees to clients to explain potential pathways and outcomes, helping them understand the reasoning behind strategic choices.
- Process Optimization: Internally, decision trees can help teams standardize processes and ensure consistent decision-making across different departments or projects.
By carefully editing your decision tree infographic and tailoring it to your specific needs, you can create a powerful visual tool that aids in clear communication and effective decision-making.
Share Now!


